arrow_back_ios

Main Menu

See All Software See All Instrumente See All Aufnehmer See All Schwingungsprüfung See All Elektroakustisch See All Akustische End-of-Line-Testsysteme See All Events See All Akademie See All Anwendungen See All Industrien See All Kalibrierung See All Ingenieurdienstleistungen See All Unterstützen
arrow_back_ios

Main Menu

See All Durability See All Reliability See All Analyse Simulation See All DAQ See All API Treiber See All Dienstprogramm See All Vibrationskontrolle See All Kalibrierung See All DAQ See All Handheld See All Industriell See All Power Analyzer See All Signalaufbereiter See All Akustik See All Strom und Spannung See All Weg See All Kraft See All Wägezellen See All Mehrkomponenten See All Druck See All Dehnung See All Dehnungsmessstreifen See All Temperatur See All Neigen See All Drehmoment See All Vibration See All Zubehör See All Steuerungen See All Messerreger See All Modalerreger See All Leistungsverstärker See All Shaker Systeme See All Testlösungen See All Aktoren See All Verbrennungsmotoren See All Betriebsfestigkeit See All eDrive See All Sensoren für Produktionstests See All Getriebe See All Turbolader See All Schulungskurse See All Akustik See All Anlagen- und Prozessüberwachung See All Elektrische Energie See All NVH See All Kundenspezifische OEM-Sensoren See All Strukturelle Integrität See All Schwingbelastung See All Automobil & Bodentransport See All Druckkalibrierung | Sensor | Messumformer See All Kalibrierung oder Reparatur anfordern See All Kalibrierung und Verifizierung See All Kalibrierung Plus Vertrag See All Brüel & Kjær Support
arrow_back_ios

Main Menu

See All Aqira See All nCode Viewer (DE) See All Weibull++ - NEW TEST (DE) See All Weibull++ - NEW TEST (DE) See All BlockSim - New Test (DE) See All BlockSim - New Test (DE) See All XFRACAS - New Test (DE) See All XFMEA - New Test (DE) See All XFMEA - New Test (DE) See All RCM++ - New Test (DE) See All RCM++ - New Test (DE) See All SEP - New Test (DE) See All SEP - New Test (DE) See All Lambda Predict - New Test (DE) See All Lambda Predict - New Test (DE) See All MPC - New Test (DE) See All nCode - Durability and Fatigue Analysis See All ReliaSoft - Reliability Analysis and Management See All API See All Elektroakustik See All Umgebungslärm See All Identifizierung der Lärmquelle See All Produkt-Lärm See All Schallleistung und Schalldruck See All Vorbeifahrgeräusche See All Produktionsprüfung und Qualitätssicherung See All Maschinenanalyse und -diagnose See All Strukturelle Gesundheitsüberwachung See All Strukturüberwachung See All Batterieprüfung See All Einführung in die Messung elektrischer Leistung bei transienten Vorgängen See All Transformator-Ersatzschaltbild | HBM See All OEM-Sensoren für die Landwirtschaft See All OEM-Sensoren für Robotik- und Drehmomentanwendungen See All OEM-Sensoren für die Agrarindustrie See All OEM-Sensoren für Robotik- und Drehmomentanwendungen See All Strukturelle Dynamik See All Prüfung der Materialeigenschaften See All Sicherstellung der strukturellen Integrität von Leichtbaustrukturen See All Elektrifizierung von Fahrzeugen See All Seiten, die nicht migriert wurden See All Software-Lizenzverwaltung

Analyse der Systemzuverlässigkeit, -verfügbarkeit und -wartbarkeit

Explore the full functionality of the software

Reliability block diagrams (RBDs)


Easy drag-and-drop techniques allow you to build reliability block diagrams (RBDs) for the simplest to the most complex systems. 


  • Simple series and parallel configuration assume that the failure of any one component causes the system to fail, while simple parallel configuration assumes full redundancy in the system.
  • Complex will require a more advanced analytical treatment than a simple combination of series and parallel blocks.
  • k-out-of-n can be used to define k-out-of-nredundancy, where a specified number of paths leading to the node must succeed in order for the system to succeed. 
  • Load sharing for each block that supports a percentage of the total load.
  • Standby redundancy is available to become active under specified circumstances. BlockSim can model hot, warm or cold standby configurations.
  • Mirrored blocks allow you to put the exact same component in more than one location within the diagram. These blocks can be used, for example, to simulate bi-directional paths in a communications network.
  • Multi blocks can help you to save time (and space in the diagram) by using a single block to represent multiple identical components configured in series or parallel. 
  • Subdiagram options offer a virtually unlimited capability to link diagrams as components in other diagrams, which provides a variety of opportunities to encapsulate one analysis into another.

Fault tree analysis


Fault tree analysis interface supports all traditional gates and event symbols that are applicable to system reliability and related analyses. In addition, only BlockSim allows you to expand the modeling capabilities with additional logic gates that represent load sharing and standby redundancy configurations. The available event symbols include Basic, Undeveloped, Trigger, Resultant and Conditional, while the supported fault tree diagram gates include:

  • AND and OR gates
  • NOT, NAND and NOR gates
  • Voting gates
  • Inhibit gates
  • Priority AND and Sequence Enforcing gates
  • Load Sharing and Standby gates


Fault tree diagrams can be configured to display intermediate results at each individual gate. Your projects can contain both fault trees and reliability block diagrams together in the same analysis workspace. You can also integrate your fault trees and RBDs by linking a fault tree as a subdiagram to an RBD or vice versa, copying events from a fault tree diagram and pasting them as blocks in an RBD, and automatically converting any fault tree to an RBD.

Markov diagrams


Markov diagrams allow you to model the behavior of a system in various states using a memoryless process, where the next state of the system is only dependent on the transition values and the current state of the system. This gives you the ability to look at partial or degraded working states, and to start analysis in varying states. If you have the Event Analysis module you can also analyze a Markov diagram during a simulation and use the analysis result in your flowchart.

Reliability analysis via analytical diagrams


Use the convenient Quick Calculation Pad (QCP) and plot sheets to calculate and visualize key system reliability metrics such as:

  • Reliability and probability of failure
  • Reliable life (i.e., time for a given reliability)
  • BX% life (i.e., time for a given unreliability)
  • Mean life
  • Failure rate

Minimal cut sets


For each analytical diagram, BlockSim identifies the unique combinations of component failure that can cause system failure. These minimal cut sets can be used to understand the structural vulnerability of a system.


Identify critical components


FRED Reports (Failure Reporting, Evaluation and Display) provide an intuitive graphical presentation of key metrics, with color-coding to identify the ones that may be critical for system improvement. FRED reports are available for analytical and simulation diagrams.


Reliability importance plots


BlockSim provides a set of Reliability Importance plots designed to show the relative importance of each component with respect to the overall reliability of a system.

Optimum reliability allocation


BlockSim provides a tool dedicated to helping you find the most effective reliability allocation to meet a system’s reliability goal. This feature supports Equal, Weighted and Cost Optimized methods. Start at the system level and click your way to the component or failure mode level while the software automatically computes the target reliability for each item/mode and transfers it to the next.

Availability analysis via simulation diagrams


BlockSim simulation capability for reliability, availability, maintainability and supportability analysis of repairable systems is more flexible and realistic than ever. For a new system, you can use simulation results to optimize the design and make projections about how the system may perform in the field. For existing equipment, use the results for maintenance planning, throughput estimates, life cycle cost estimation and more. 

When you utilize simulation, the analysis can consider:

  • Task scheduling logistics, which includes a "Virtual Age" option for situations in which the scheduled maintenance task will be performed even if the item has failed.
  • Restoration factor that captures the impact of repairs on the future reliability of the component.
  • Duty cycles for components (or assemblies) that experience a different stress load than the rest of the system. 
  • Expected downtime associated with corrective or scheduled maintenance.
  • Costs and logistical constraints associated with allocating the personnel (repair crews) and materials (spare parts) required to perform maintenance.
  • Maintenance groups that identify components that will receive maintenance based on what happens to other components.
  • State change triggers that activate or deactivate a block under certain conditions during the simulation. This provides increased modeling flexibility for highly complex dependency scenarios, such as standby configurations and other situations when you may need to divert the simulation onto an alternate path when a particular event occurs.


BlockSim simulations generate a wide variety of results at the system and/or component level (such as Uptime/Downtime, Mean Time to First Failure (MTTFF), Availability, Reliability, Number of Failures, Number of PMs/Inspections, Costs, etc.). You can use these results for many different applications, including:

  • Choosing the most effective maintenance strategy based on considerations of safety, cost and/or availability.
  • Using the optimum replacement tool to calculate both the optimum preventive maintenance (PM) and/or optimum inspection intervals.
  • Managing the spare parts inventory based on considerations of cost, utilization rate, supply bottlenecks, etc.
  • Identifying the components that have the biggest impact on availability (downtime).


The Log of Simulations feature provides the information you need to evaluate the variability in specific simulation results of interest. 

Use the linear, exponential, power, logarithmic, Gompertz or Lloyd-Lipow models to extrapolate the failure times of a product based on its performance (degradation) over a period of time. Weibull++ also includes destructive degradation analysis and the option to create user-defined degradation models.

Life cycle cost estimation


BlockSim allows you to specify both the direct and indirect costs associated with the maintenance strategies that you have defined, including costs related to downtime, maintenance crews, spares, etc. This yields a wide array of simulation results that are instrumental in performing realistic LCC assessments. With BlockSim modeling flexibility, you can:

  • Specify what kinds of crew delays are included in cost calculations and what delays should be ignored.
  • Specify costs associated with system failure, including cost per incident and downtime rate.
  • Specify system uptime revenue and revenue due to throughput so the simulation is able to calculate opportunity costs.
  • View new cost-related simulation results, including system-level costs, the contributions of different kinds of wait times to block costs and the contribution (criticality) of a block's cost to the total system costs.

Phase diagrams


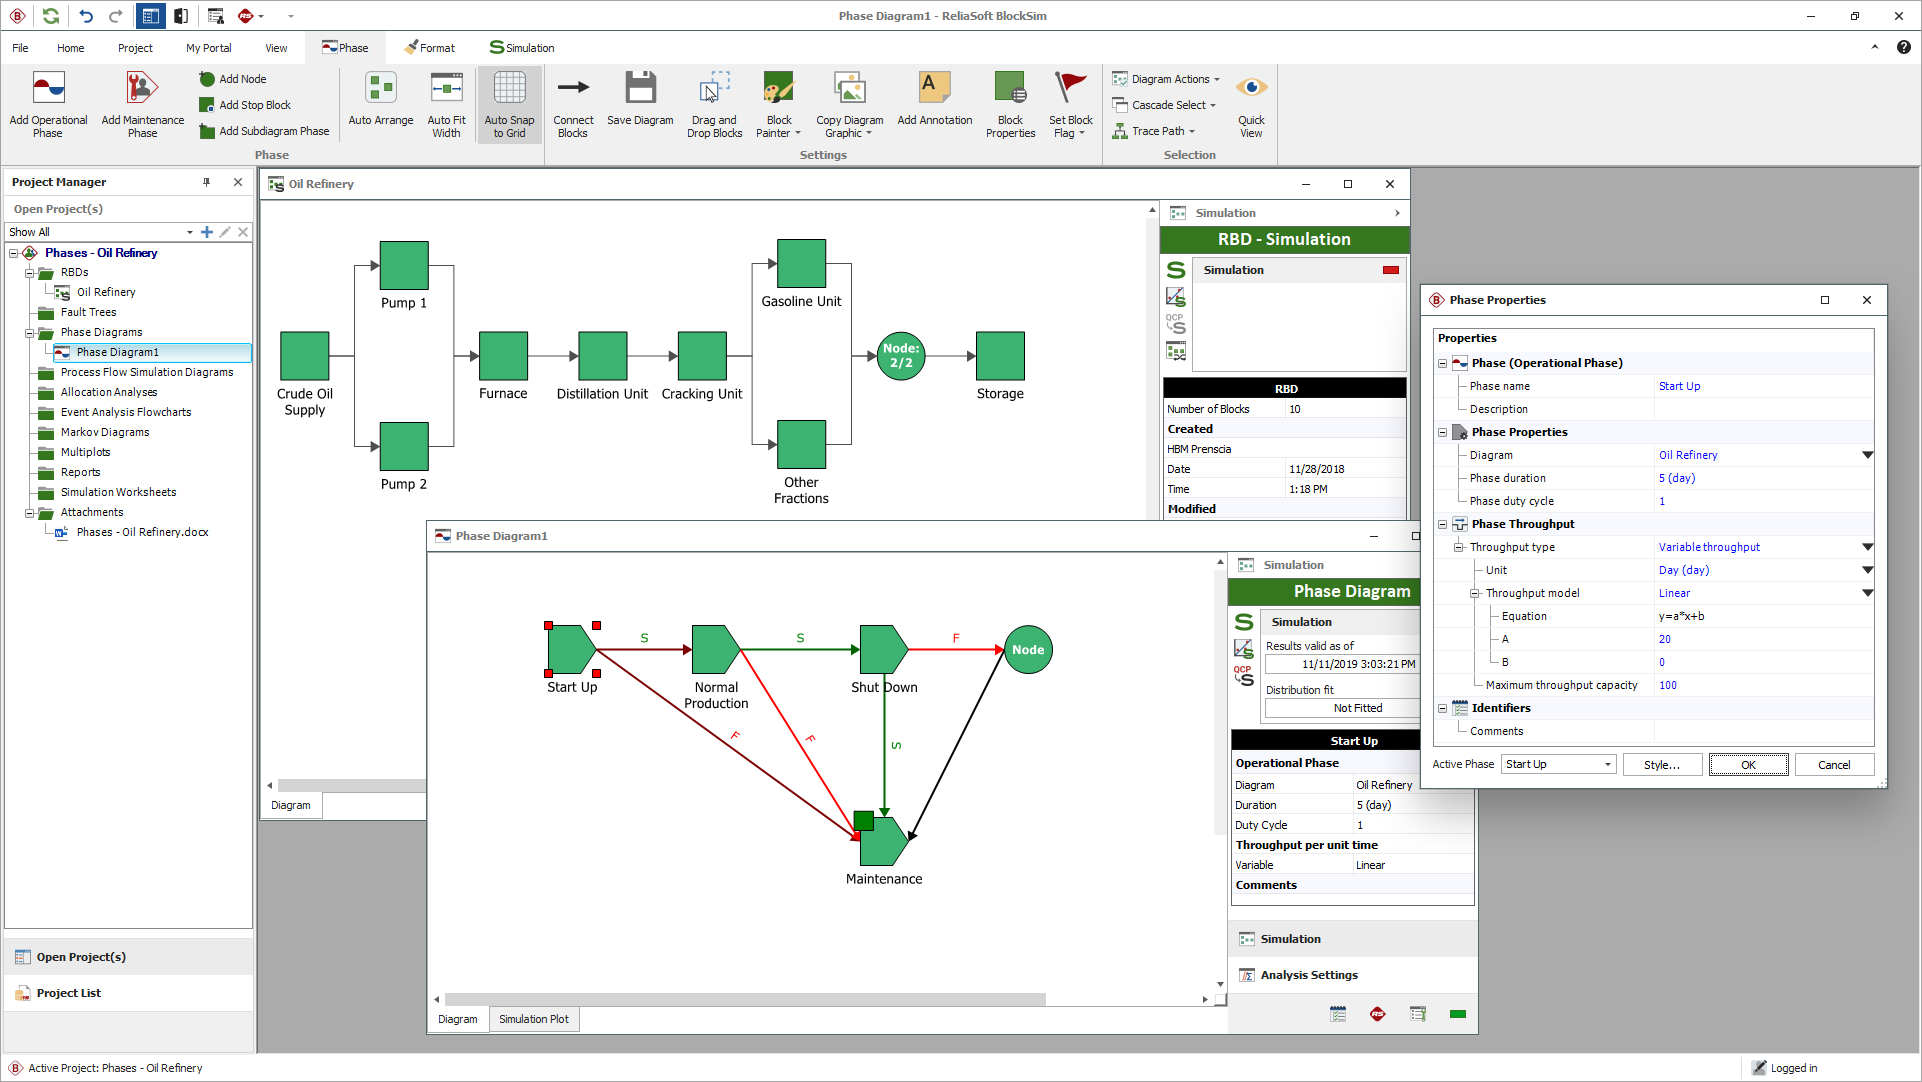
You can use reliability phase diagrams (RPDs) to model systems that go through different phases during the course of their operation. For example, some aircraft components operate only during the take-off and landing phases of a mission. Other components may experience a higher failure rate during certain phases due to higher stress.


In addition, the software uses Maintenance Phases to model scenarios in which a system goes directly to maintenance under specified conditions. For example, if a failure during the taxi phase sends an aircraft in for maintenance, it will start over from the beginning of the mission once repaired — not from the middle of the taxi phase where it was when the failure occurred, as other RBD analyses have been forced to assume. This flexibility provides a tremendous leap forward in the ability to simulate system operation more realistically.


BlockSim includes success/failure paths, for situations where a system proceeds to one operational phase upon success and a different operational phase upon failure. Node blocks and stop blocks are included as well.

"What-if" scenario simulation using variables


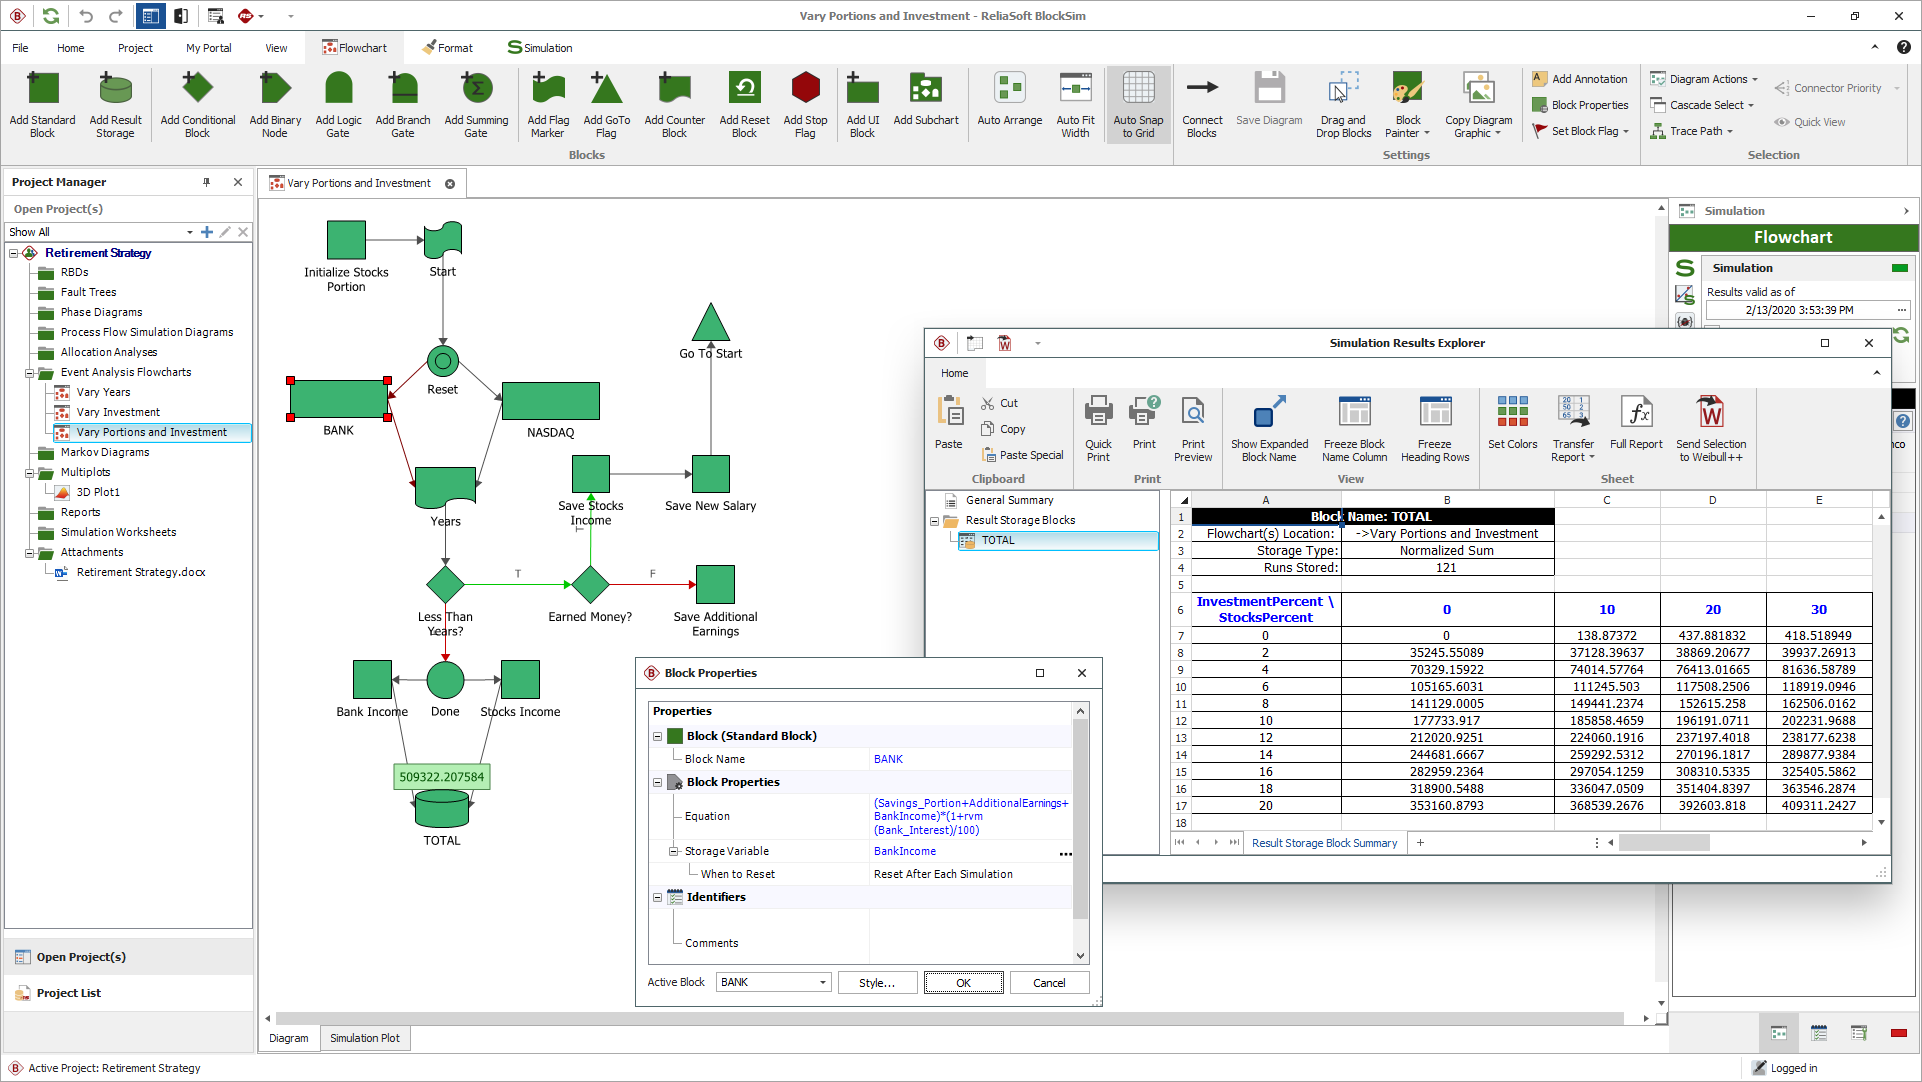
The Simulation Worksheets feature allows you to vary values that are used in BlockSim RBD or Event Analysis module simulations. This enables you to investigate the effect of one or more variables on the simulation results. With those two useful applications, you can:

  • Design an experiment in Weibull++ —> simulate the experiment in BlockSim (and Event Analysis module)—> then return to Weibull++ and analyze the simulated "response" data.
  • Perform batch simulation of an RBD, using different input values for each simulation. For example, this tool makes it easy to run a set of simulations that compare a variety of possible scenarios by altering specific inputs (e.g., cost, maintenance interval, etc.) for each simulation.

Throughput analysis


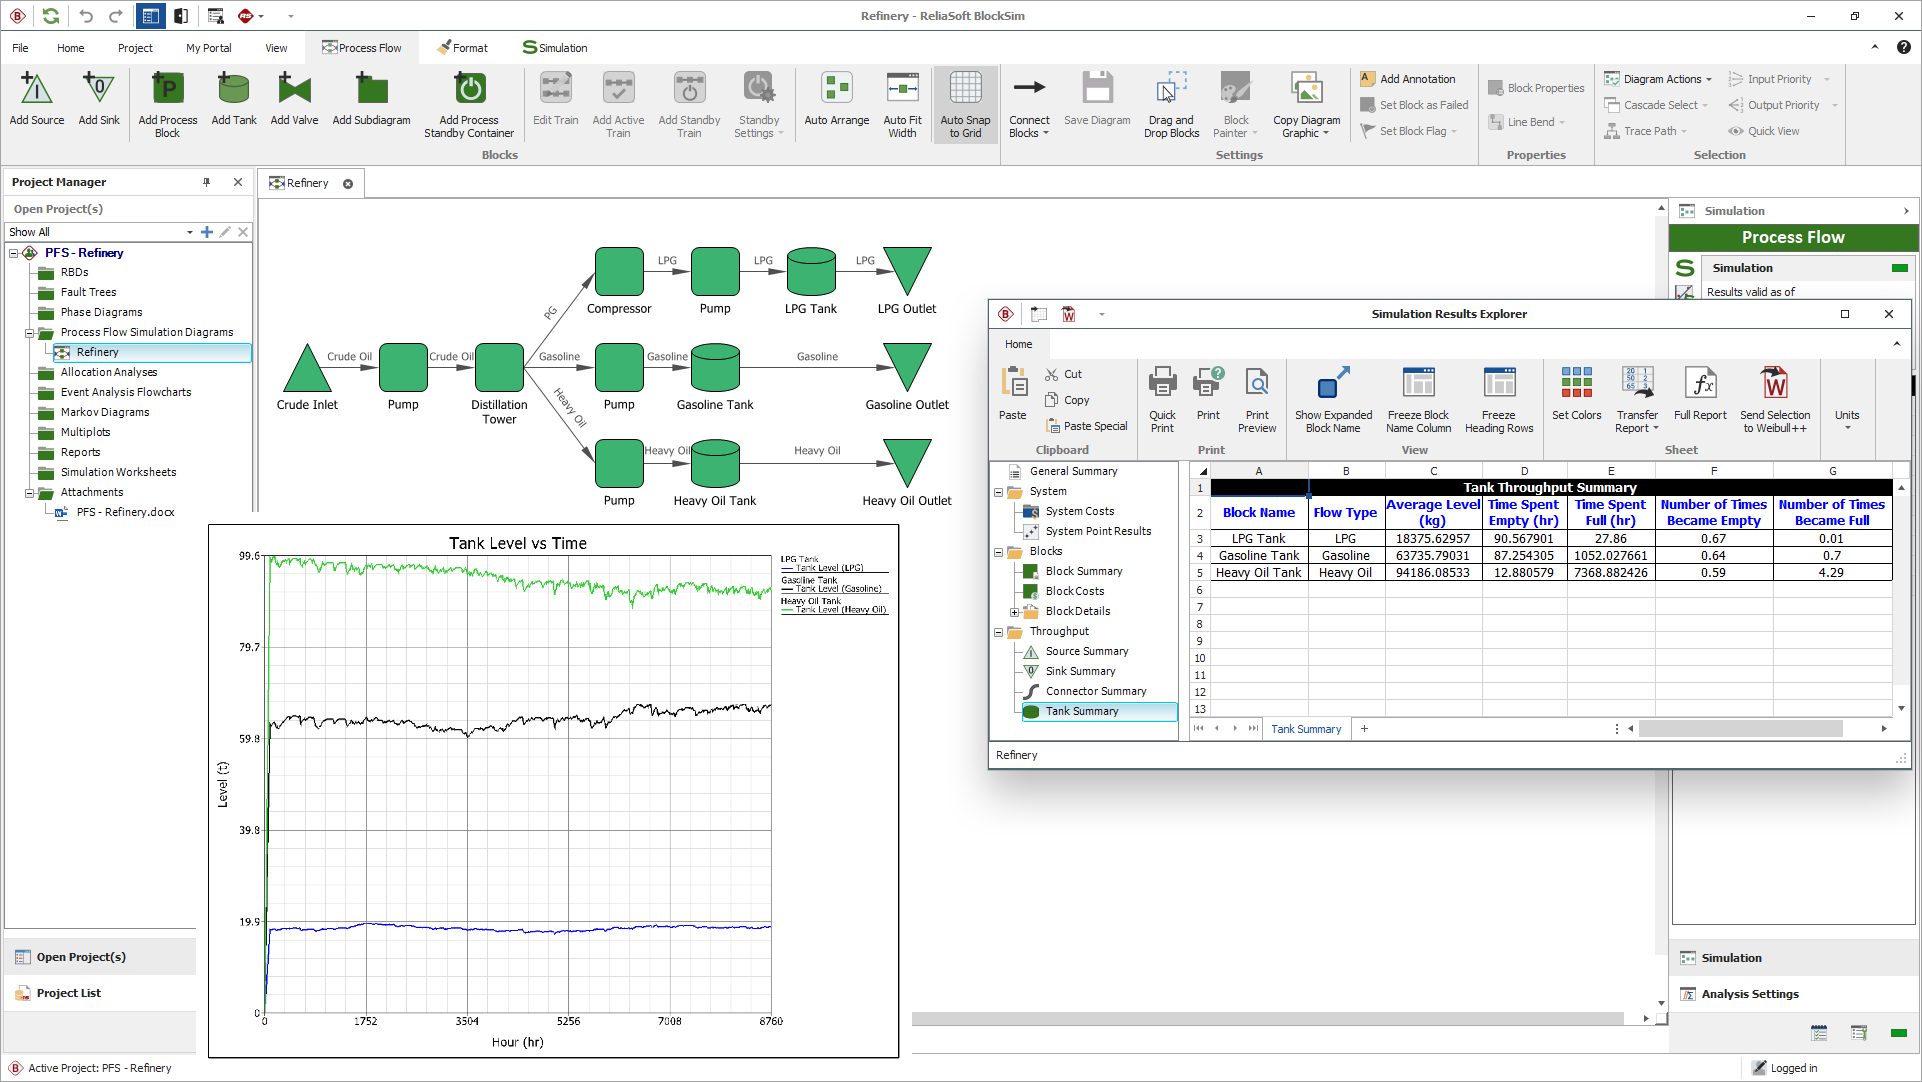
The throughput analysis can be used to identify bottlenecks, optimize resource allocation and otherwise improve the processing efficiency of the system. The software allows you to determine how the simulation will allocate the processed output across the paths defined in the diagram. It also allows you to specify how the backlog will be processed. When the throughput varies over time, BlockSim phase diagrams can be combined with models to describe the time-dependent variability (linear, exponential or power).

Multi-thread support and batch mode


BlockSim allows you to run simulations in multiple threads. This may improve performance and save time when simulating complex diagrams. Additionally, the Batch Mode feature improves productivity by allowing you to schedule a series of simulations in advance. 

Plots and reports


Visualize your analysis results with variety of plots and charts options:

  • Plot setup allows you to completely customize the "look and feel" of plot graphics while the RS Draw metafile graphics editor provides the option to insert text, draw objects or mark particular points on plot graphics. You can save your plots in a variety of graphic file formats for use in other documents.
  • Overlay plots allow you to plot multiple results together in the same plot. This can be an effective visual tool for many different purposes, such as comparing different analyses (e.g., Design A vs. Design B) or demonstrating the effects of a design change (e.g., Before vs. After).
  • Customizable reports seamlessly integrate spreadsheet and word processing capabilities while enabling you to include calculated results and plots from your analysis.

Process Flow module


Process Flow module captures system availability and maintainability based on reliability numeric by providing the ability to simply create and simulate various flow models. The combined capability allows a wider number of operating scenarios to be modelled thus delivering essential insight to improve organizational processes, increase operational efficiency, and reduce the costs of output. This module option is available at an additional cost.

Event Analysis module


Event Analysis is designed for building and running complex analyses for any probabilistic or deterministic scenario. It provides an array of definitions and designs that will allow you to model the situation you wish to examine. It uses an intuitive flowchart modeling approach and simulation to support your decision-making process and can be also used to estimate or optimize the results needed for further analysis. This module option is available at an additional cost.

Ready to take your reliability program further?