
Vibration monitoring: From data to decisions
Guga Gugaratshan explores how to strengthen data integrity, avoid pitfalls, and apply next-gen AI to improve vibration-based condition monitoring.
Read More

In the offshore wind and renewable energy sectors, critical structures face a relentless barrage of environmental loads, shifting seabeds, and extreme weather conditions. Visual inspections can only show what is already visible on the surface, but how do operators understand what is happening beneath the surface of these multi-million-dollar assets?
We sat down with Arnt-Henning Andersson, Director of Engineering Services at HBK and a 28-year veteran who has personally installed over 3,000 strain gauges in the field, to discuss the realities of Structural Health Monitoring (SHM), the challenges of capturing reliable data in harsh environments, and why monitoring is critical to extending asset life, enhancing safety and supporting predictive maintenance.
Presenter: Arnt-Henning Andersson, Director of Engineering Services at HBK.
Duration: 30 min.
Language: English

Visual inspections simply do not give you enough information to extend a structure’s lifetime. By monitoring structural health in real time, you detect anomalies early, optimise your maintenance windows, and significantly reduce operational costs.
Arnt-Henning Andersson, Director of Engineering Services at HBK.
Arnt-Henning: For me, it is about one main thing: predictive maintenance. You want to identify structural issues or anomalies at a very early stage. I like to call it being ahead of the game.
If your measurements can help predict the lifetime of a structure, that can result in extended certification periods or longer operational life. Whether you are validating a brand-new design or responding to physical changes in the environment – such as seabed movement around a wind turbine monopile, landslides or extreme temperature variations – monitoring gives you the data needed to make better decisions.
Arnt-Henning: I love these three curves because they make the business case incredibly clear.
Green curve: continuous prevention:
You are actively using your monitoring system to perform planned, preventive maintenance. Problems are identified early and your asset continues operating efficiently with minimal disruption.
Yellow curve: quick detection:
You detect damage as it occurs. You can still avoid catastrophic failures, but repair costs are higher because some level of damage has already taken place.
Red curve: no monitoring:
You have no visibility into the condition of the asset and only react after a major failure occurs. This is where repairs become extraordinarily costly. Downtime increases and safety risks grow significantly.
With today’s structures subjected to an exponential increase in applied loads and environmental burdens, understanding structural behaviour is no longer optional; it is essential to guarantee safety.
Arnt-Henning: Obtaining reliable data and maintaining high signal quality are the biggest challenges.
Large steel structures are not naturally designed to deliver clean electrical measurement signals. In fact, the strain levels we are trying to measure are extremely small. For comparison, a conventional force transducer is intentionally designed to produce a large signal of around 1,000 to 2,000 micrometres per metre. On an offshore wind turbine, however, we are often trying to measure peak-to-peak strain levels of only 30 to 50 micrometres per metre.
A strain level of just 50 micrometres per metre signal translates to approximately 0.0625 millivolts – an incredibly small signal. When that signal has to travel through 100 metres of cable on a large structure, it can easily be affected by interference and drift.
Add long cable distances, remote locations, and the need to synchronise multiple measurement systems, and you it becomes clear why good engineering and the right sensor choice are so important.
Arnt-Henning: It really comes down to choosing the right sensor technology for the right location. At HBK, we typically divide the asset into zones.
For example, on an offshore wind turbine – below the waterline on the monopile – we would usually recommend optical fibre sensors because of the long distances involved and the constant exposure to water. We can weld these Fiber Bragg Grating (FBG) strain sensors directly onto the structure, which eliminates the need for a complex bonding process.
As we move above the waterline – to the transition piece and further up into the tower – we deploy electrical sensors such as accelerometers and inclinometers.
Combining these technologies gives us a much more complete understanding of structural behaviour, but it also requires specialised hardware. We connect the sensors to our data acquisition cabinets, using universal modules such as the QuantumX MX840 for accelerometers, the MXFS interrogators for optical lines and the MX1615 for conventional electrical strain gauges.
Arnt-Henning: That’s a critical point because synchronisation is everything.
When measurements are being collected from multiple locations across a large structure, all the data needs to align perfectly in time. Otherwise, it becomes extremely difficult to understand what is happening.
To solve this challenge, we use hybrid synchronised measurement systems based on Network Time Protocol (NTP). Whether the measurement is coming from an optical strain sensor below the waterline or an electrical accelerometer high up in the tower, the data remains synchronised down to the millisecond.
Our engineering teams configure these projects through catman® software, which allows us to set individual sample rates and input precise sensor parameters. Because the amount of data generated can be enormous, catman typically stores the raw data in configurable time blocks, such as fifteen minutes, one hour or one day.
This allows engineers to quickly locate and analyse anomalies, helping them understand exactly how wind and waves are affecting the structure.
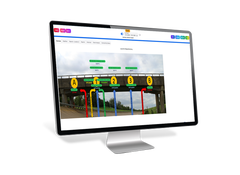
Arnt-Henning: Ideally, the system should function as a simple, real-time warning tool, much like a traffic light:
Green: normal operation
Everything is operating within expected limits. The asset can continue to run at full capacity.
Yellow: warning
An anomaly or high-load threshold has been reached, for example, wind speeds may have exceeded a specified limit. Operators can take preventive action, such as temporarily reducing rotor speed or adjusting blade pitch.
Red: immediate action required light
The system has identified a condition that requires immediate attention Operations should be stopped and the asset inspected before serious damage can occur.
By turning complex, measurement data into a highly visual green-yellow-red framework, operators can prevent critical situations and keep operations running safely.




The WSDA-101 is a wireless gateway that streams synchronized sensor data to your DAQ systems with up to eight analog output channels (0–3 VDC). It offers ±50 μs synchronization, lossless throughput, and easy USB connectivity for seamless integration with MicroStrain LXRS sensor networks.

Bi or Tri-axis high sensitivity accelerometer for detecting tiny movements in large structures.
This will bring together HBM, Brüel & Kjær, nCode, ReliaSoft, MicroStrain and Discom brands, helping you innovate faster for a cleaner, healthier, and more productive world.
