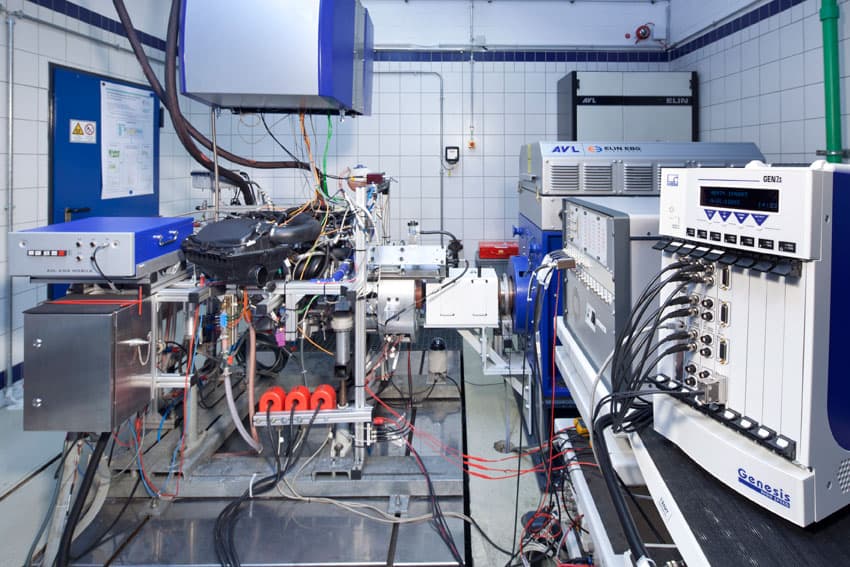
How can video support classic sensor data?
HBM conducted a survey with 100 respondents in eight European countries in autumn 2016. In summary, the survey shows that recording video data in parallel to tactile sensors or digital bus signals is becoming increasingly attractive to users. The format of the recordings can vary from true film to just a snapshot picture, resulting in a true sensor or digital data fusion.
The survey shows:
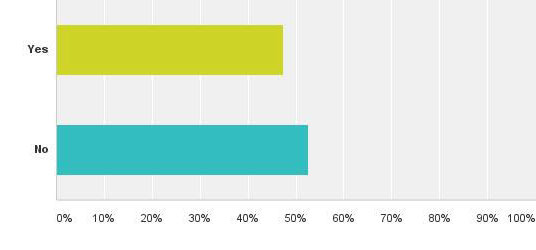
- Video use in data collection is relatively widespread. Almost half of the respondents (47%) already use video in data recording today.
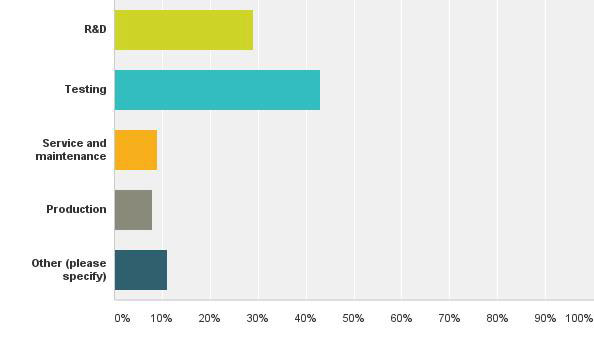
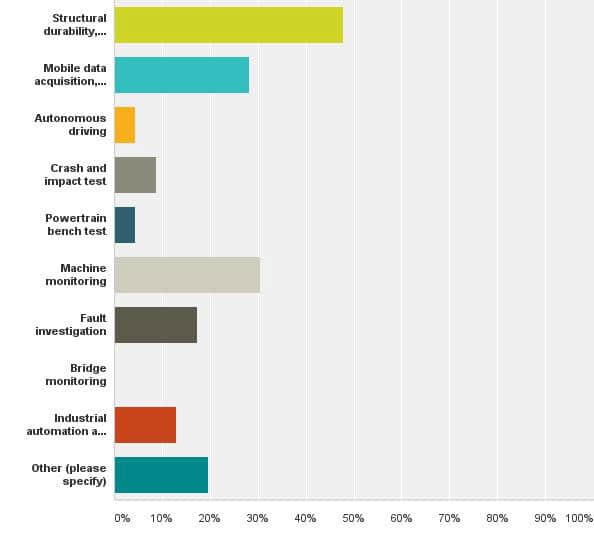
- Video is most commonly used in structural durability, fatigue testing (48%). Machine monitoring or general lab testing (30%) and mobile data acquisition or road load data acquisition (28%) are also relatively common areas of application.
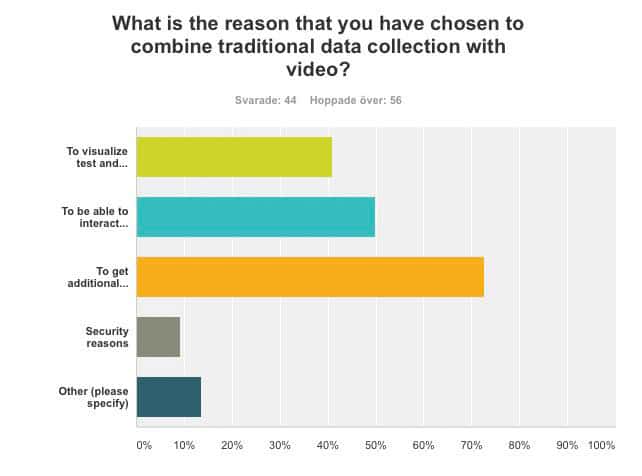
- The most common reason for using video in data collection is to gain additional inputs analyzing unexpected deviations (73%). Other common reasons are decision finding (50%) and visualization of results for management (41%).
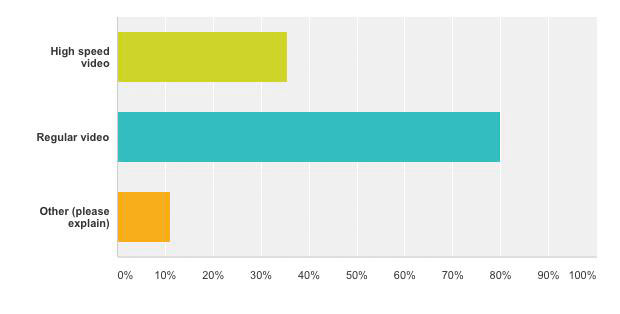
- Regular video is by far the most common equipment for video in data collection. In our survey, 80% respondents use such video. High speed video is used by over a third of the respondents (36%), often in combination with traditional video.
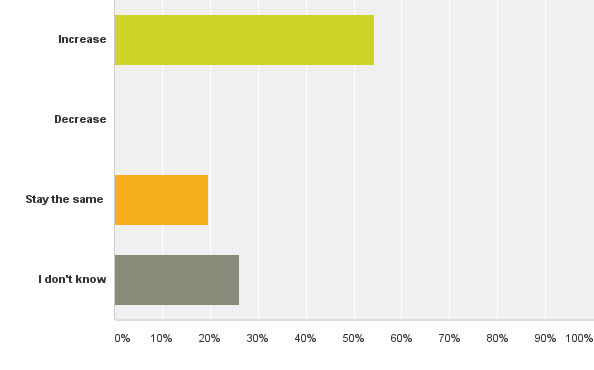
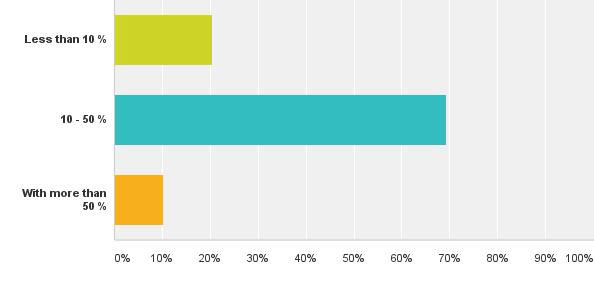
- The survey indicates that use of video in data collection is likely to increase substantially in subsequent years, which is indicated by both sides: those already using video today and those who are not. In total, 54% respondents expect video use in data collection within their organization to increase. Among non-users it amounts to 37%.
- Use brings more use: Those already using video are more prone to increase their usage in subsequent years (76%). None of those already using video expect video usage in general to decrease in the next year.