${/keySellingArguments/1/value}
A semiconductor company is studying the reliability of Light Emitting Diodes (LEDs) using a step-stress accelerated temperature test to estimate the reliability at the normal conditions of TN= 200K. For LEDs, failure has traditionally been defined in terms of the amount of degradation in luminosity or luminous flux (in lumens per radiated watt). For this particular LED product, the industry defines failure as 50% degradation from the original luminous flux of 700 lm.
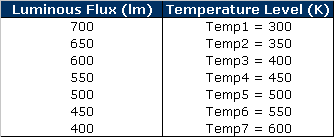
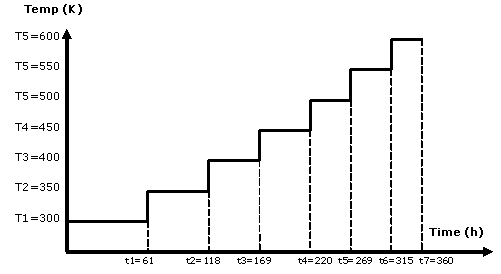
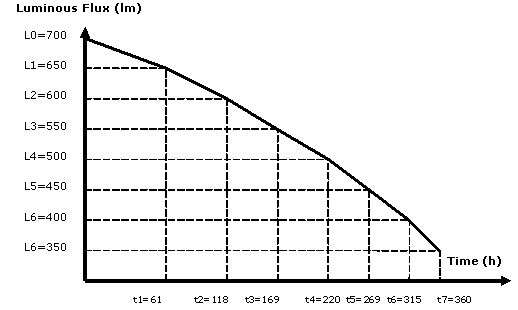
The following is the test procedure. A sample of 15 units are tested in a temperature bath. Each unit is tested under the designated test profile independently from the other units. The luminous flux degradation is monitored for every unit in the test. The test's temperature is initially set at T1 = 300K and is then increased by 50K for every 50 lm drop in luminous flux.
The purpose of this test is to estimate the reliability of the LEDs at the normal continuous usage conditions of TN=200K.
For illustration purposes, let us assume that the luminous flux decreases linearly over time at a certain temperature level, Ti (Chiao, Hamada, 1996). Therefore, the relationship between luminous flux (L) and time (t) can be described as follows:
Eqn. (1) |
where L0 = 700 lm is the initial luminous flux and λi is the degradation rate. Note that other models could be considered.
Table 1 can be used to estimate degradation rate at a certain temperature value. The degradation rate, λi, can be estimated by calculating the drop of luminous flux over a certain change of time. Therefore:
Eqn. (2) |
In the studied experiment, the temperature is changed once a drop of 50 lm has been observed, thereforeΔLi = 50 lm consistently.
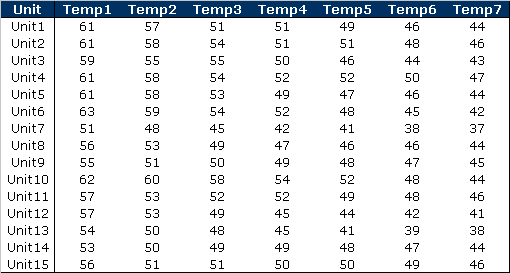
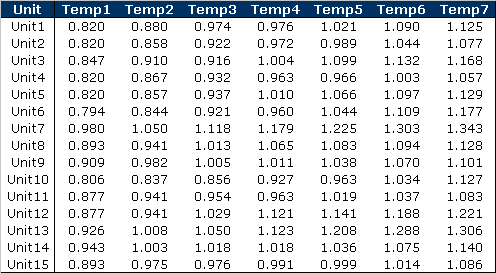
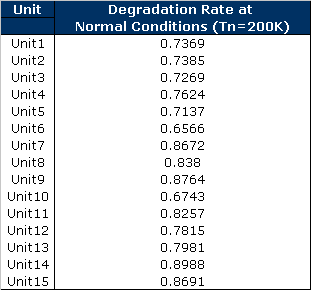
From Table 2, we obtain the following table that uses Eqn. (2) to estimate the degradation rate, λi, at a certain temperature level, Ti. Note that in this case the degradation rate is a random variable, therefore each unit's data set enables us to estimate a possible value of degradation for a certain temperature level.
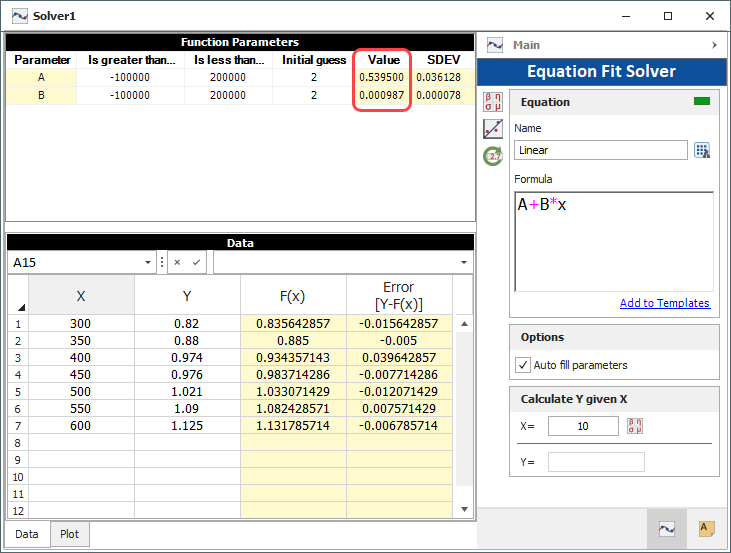
The degradation model can help in understanding what the degradation rate would be if a unit were tested under normal conditions of TN= 200K.
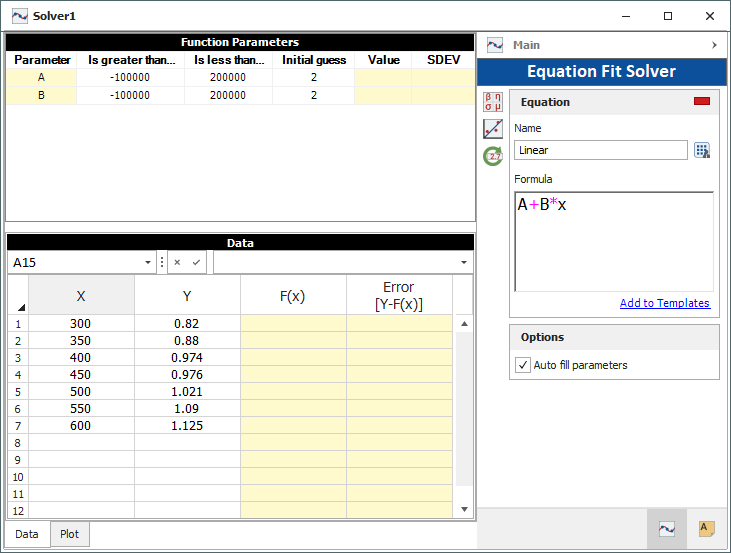
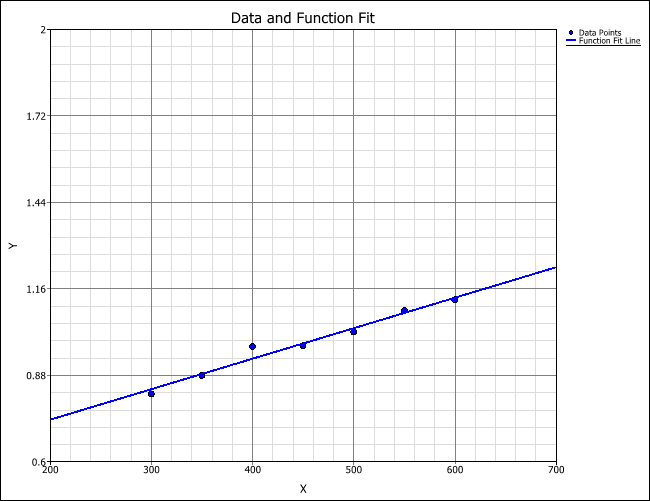
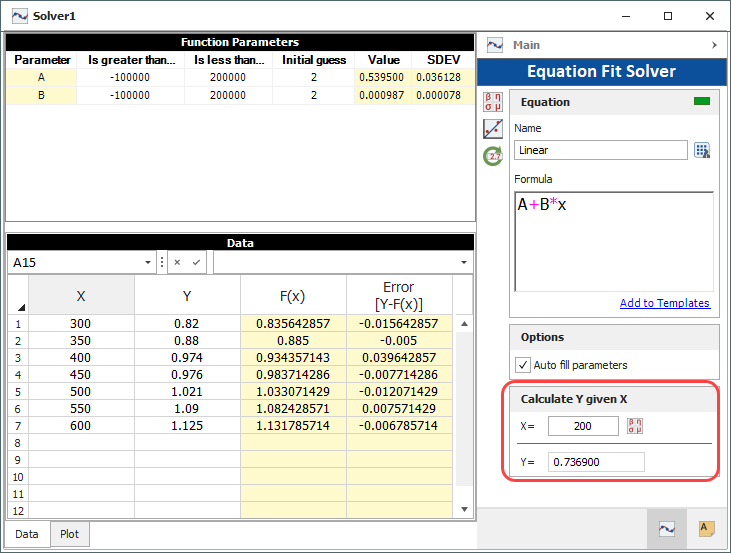
Using the Equation Fit Solver, we can estimate the degradation rate for a certain temperature value. In the Calculate Y given X section, enter the X=200 value and click to obtain the estimated degradation rate value for TN= 200K.
With the degradation rate at normal condition, the failure time for each unit can be estimated. Modifying Eqn. (1) to solve for the failure time tF, the equation becomes:
Eqn. (3) |
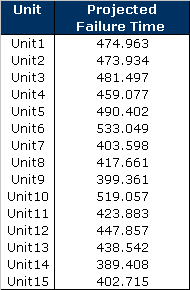
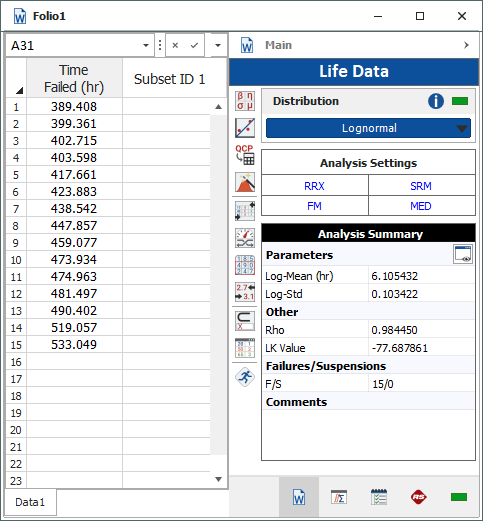
Using Eqn. (3) and Table 4, the estimated failure times for each unit had they been continuously tested under the normal condition, TN, are:
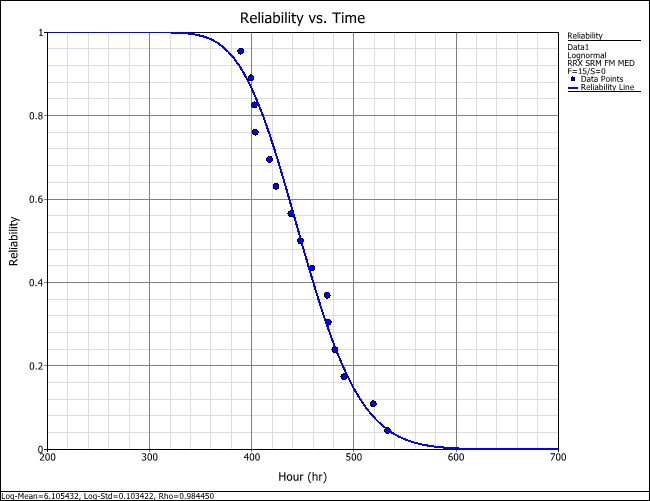
Using the data in Table 5, the reliability estimation using life data analysis becomes straightforward. The lognormal distribution and regression (RRX) are used to fit the failure data.
C. Chiao, M. Hamada, "Robust Reliability For Light Emitting Diodes Using Degradation Measurements", Quality and Reliability Engineering International, Vol. 12, 89-94 (1996).