arrow_back_ios

Main Menu

See All ソフトウェア See All 計測器 See All トランスデューサ See All 振動試験装置 See All 電気音響 See All 音響エンドオブライン試験システム See All アプリケーション See All インダストリーズ See All キャリブレーション See All エンジニアリングサービス See All サポート
arrow_back_ios

Main Menu

See All 解析シミュレーション See All DAQ See All APIドライバ See All ユーティリティ See All 振動コントロール See All 校正 See All DAQ See All ハンドヘルド See All 産業 See All パワーアナライザ See All シグナルコンディショナー See All 音響 See All 電流電圧 See All 変位 See All 力 See All ロードセル See All マルチコンポーネント See All 圧力 See All ひずみ See All ひずみゲージ See All 温度 See All チルト See All トルク See All 振動 See All アクセサリ See All コントローラ See All 測定加振器 See All モーダル加振器 See All パワーアンプ See All 加振器システム See All テストソリューション See All アクチュエータ See All 内燃機関 See All 耐久性 See All eDrive See All 生産テストセンサ See All トランスミッションギアボックス See All ターボチャージャ See All アコースティック See All アセット&プロセスモニタリング See All 電力 See All NVH See All OEMカスタムセンサ See All 構造的な整合性 See All 振動: See All 自動車・陸上輸送 See All 圧力校正|センサー|振動子 See All 校正・修理のご依頼 See All キャリブレーションとベリフィケーション See All キャリブレーション・プラス契約 See All サポート ブリュエル・ケアー
arrow_back_ios

Main Menu

See All nCode - 耐久性および疲労解析 See All ReliaSoft - 信頼性解析と管理 See All API See All 電気音響 See All 環境ノイズ See All 騒音源の特定 See All 製品ノイズ See All 音響パワーと音圧 See All 自動車通過騒音 See All 生産テストと品質保証 See All 機械分析・診断 See All 構造物ヘルスモニタリング See All バッテリーテスト See All 過渡現象時の電力測定入門 See All トランスの等価回路図|HBM See All アグリ業界向けOEMセンサー See All ロボティクスとトルクアプリケーション用OEMセンサー See All 構造ダイナミクス See All 材料特性試験 See All pages-not-migrated See All ソフトウェアライセンス管理

Reliability Centered Maintenance

RCM standards


RCM++ provides predefined profiles that make it easy to configure the analysis workspace to fit the major RCM and FMEA reporting standards, such as:

  • SAE JA1011/1012 for RCM
  • MSG-3
  • NAVAIR 00-25-403


In addition, the software offers flexible capabilities to customize any of the sample profiles or create your own settings to meet the specific needs of your organization.

Reliability Centered Maintenance (RCM) analysis


Equipment selection


In order to focus resources where they can provide the greatest benefit, the Risk Discovery Analysis feature provides a choice of two configurable methods to determine which equipment will be analyzed with RCM techniques.


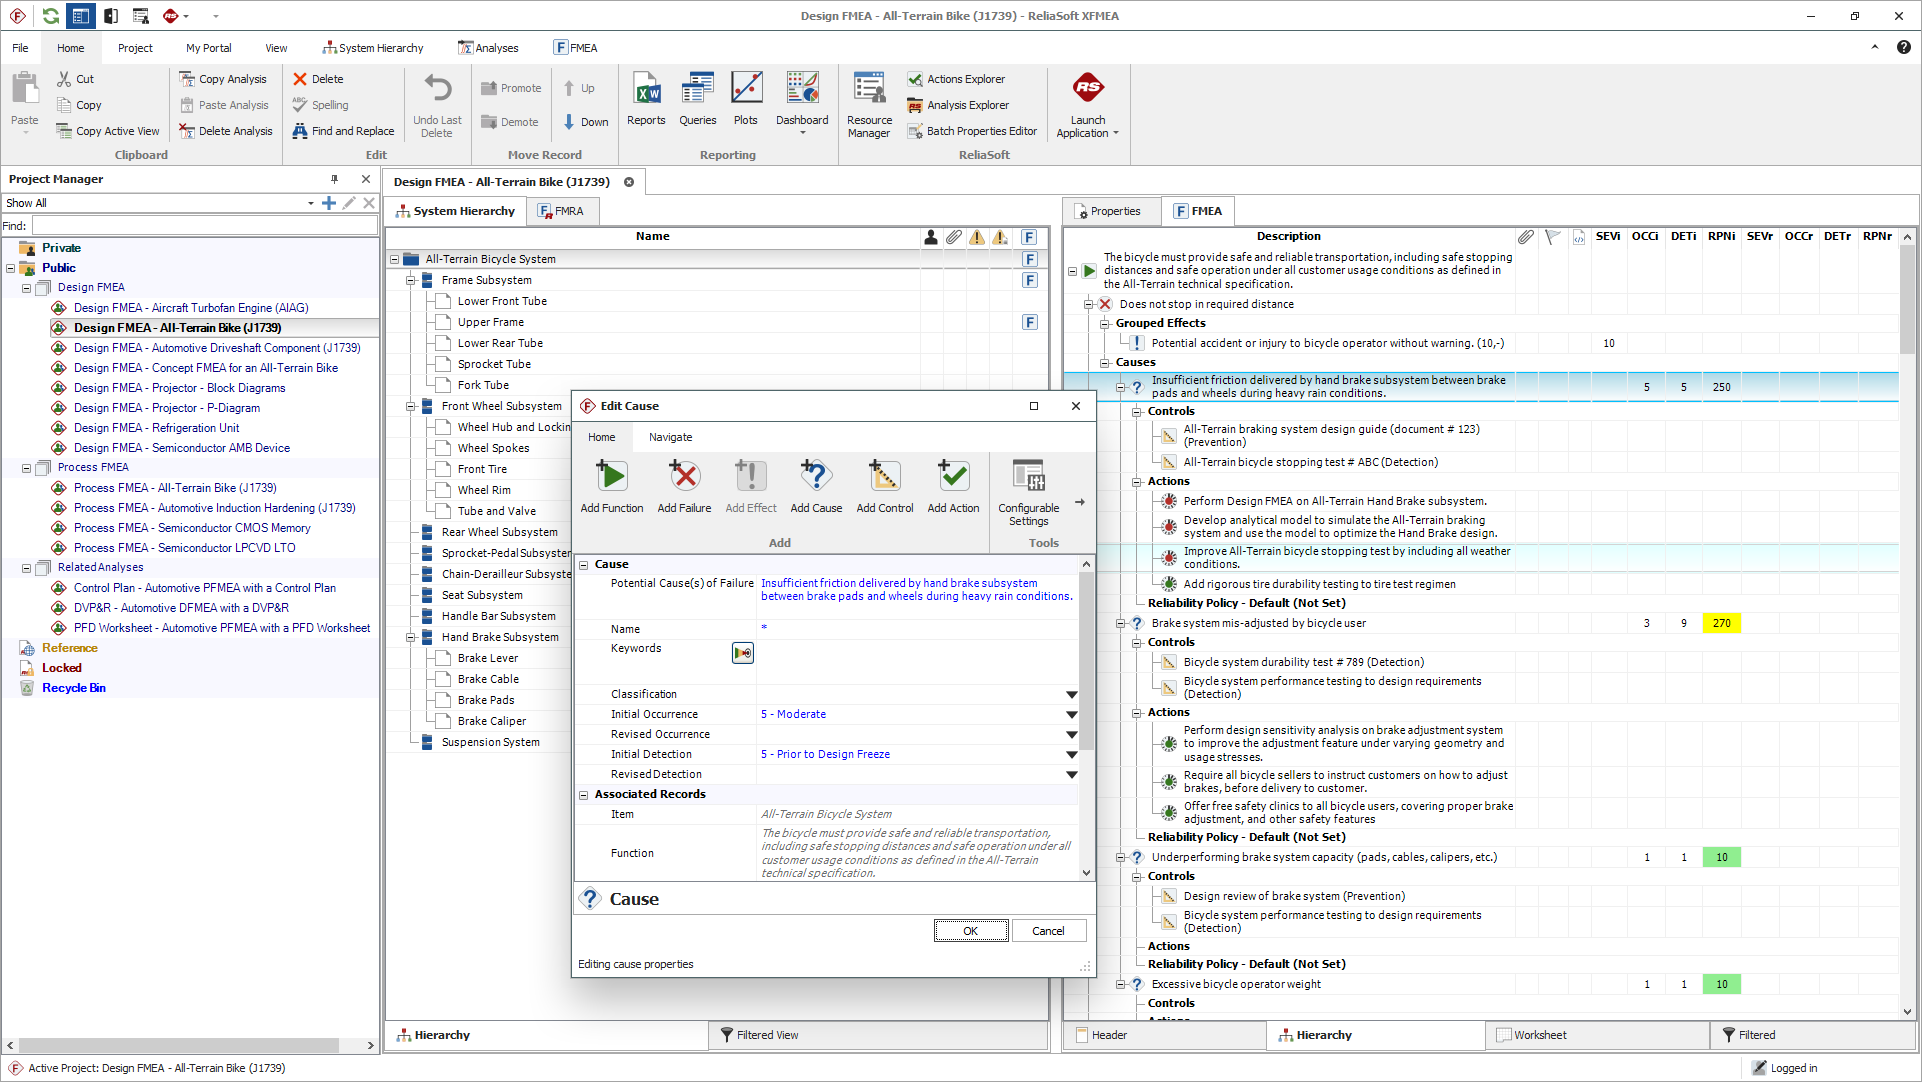
Functional failure analysis


The Analysis panel makes it easy to switch back and forth between three complementary views of the functional failure analysis information so you can choose the display that is best suited for your current activity.

  • The FMEA Hierarchy displays a lot of information in a compact space, where you can choose to display and enter causes before effects, if desired.
  • The Worksheet View allows you to type directly in the worksheet cells and tab through the analysis as you would in a spreadsheet application such as Microsoft Excel.
  • The Filtered View allows you to generate sortable lists of records of a type. For example, you may wish to see maintenance task records sorted by type, assigned interval, duration or cost.


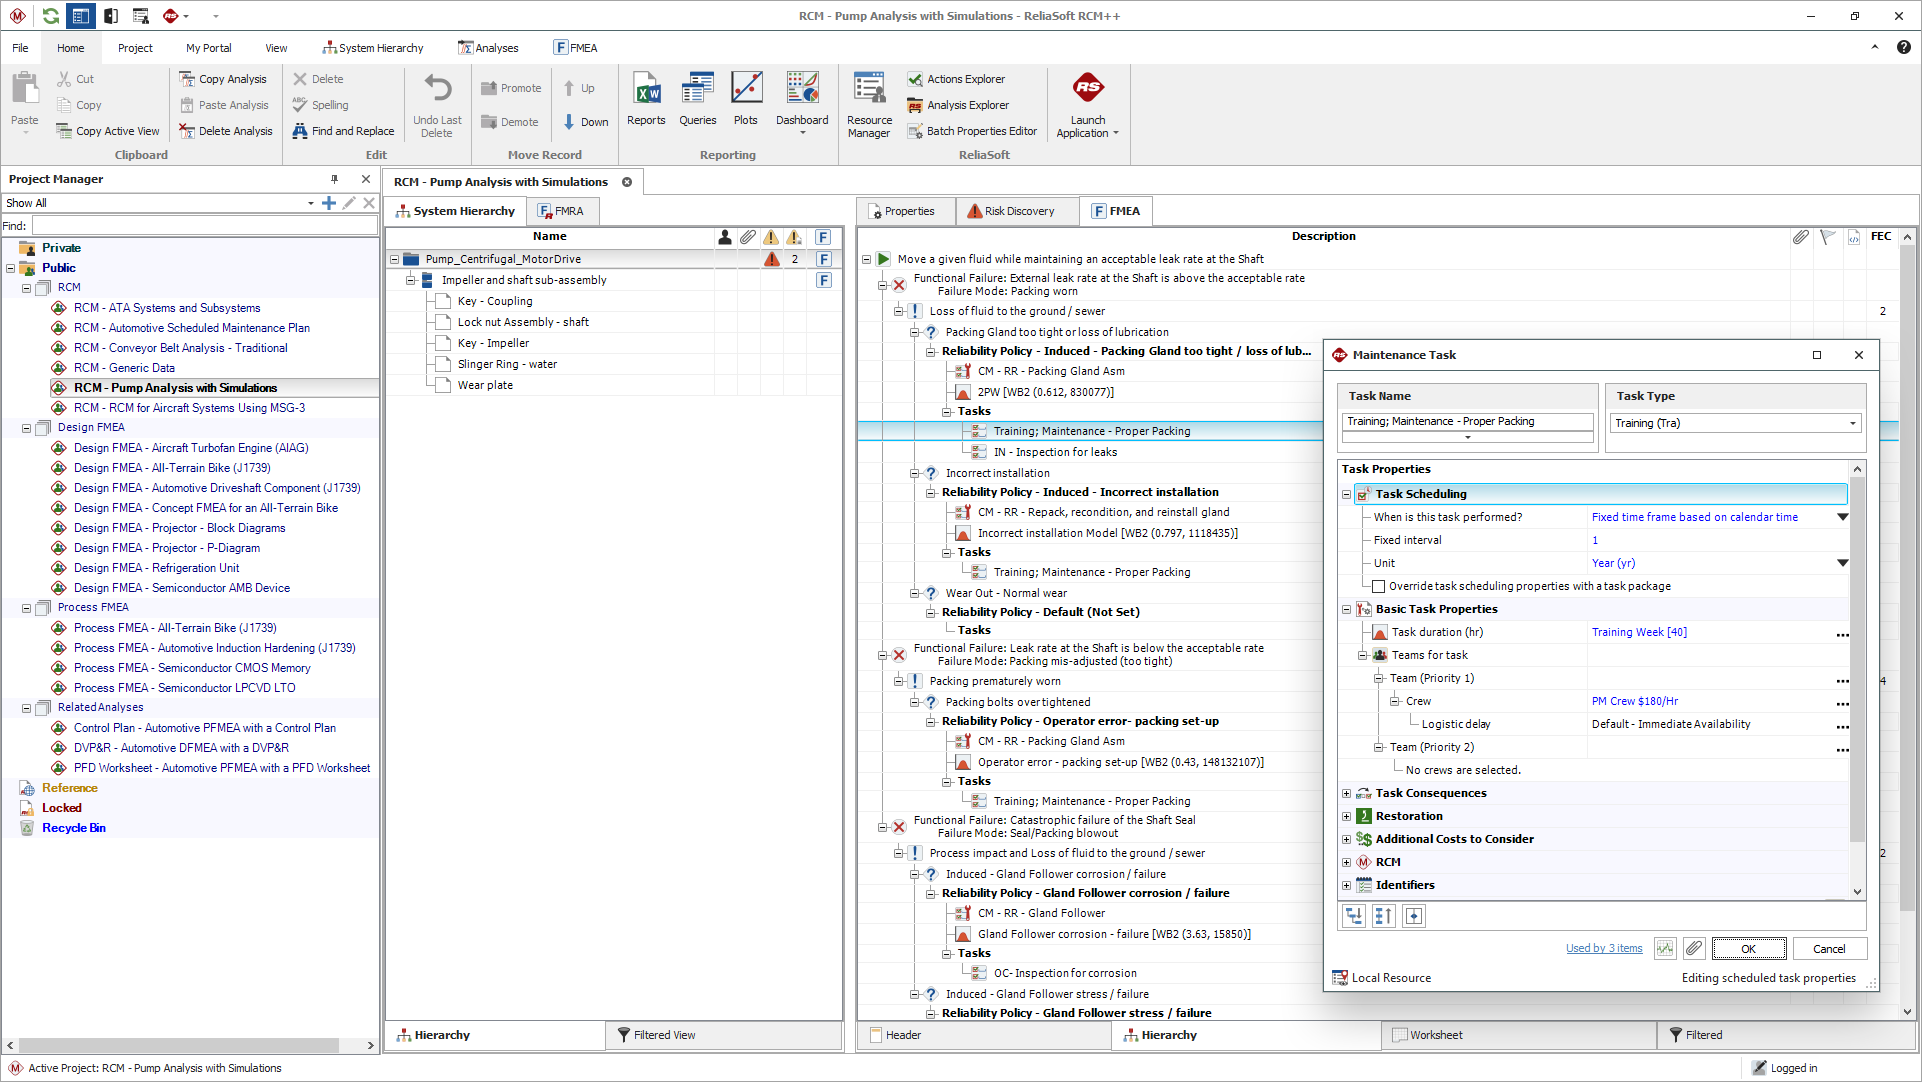
Failure effect categorization and maintenance task selection


RCM++ supports the failure effect categorization (FEC) and maintenance task selection logic charts in the major industry RCM standards. You also have the option to customize the questions, categories and task types to fit your own specific analysis procedures.These configurable logic diagrams can help guide the analysis team to discuss the consequences of potential failure modes and consider the maintenance strategy that will be most applicable and effective.


Task packaging


It is easy to group individual tasks into packages based on factors such as time (scheduled interval), task type and areas in the system where tasks are performed. You can manually assign a task to the appropriate maintenance package or allow the software to automatically group tasks based on the criteria that you have specified for each package.

Maintenance strategies


Maintenance strategies based on cost and availability


Even when you choose to use the predefined decision logic diagrams employed by traditional RCM methods, those guidelines still require the analysis team to utilize their knowledge of the equipment's failure behavior when making decisions about the appropriate maintenance strategy. The built-in simulation and calculation engines help with these assessments.


Variety of statistical distributions to describe the failure behavior


RCM++ allows you to more accurately describe the probability of failure by providing a choice of ten distributions. Integration with Weibull++, and BlockSim software makes it possible to obtain the failure time distribution and parameters from an existing data analysis or RBD/fault tree. The software also provides the Quick Parameter Estimator (QPE) utility to help you estimate the distribution parameters based on limited information.


Maintenance strategies evaluation based on system availability at lowest cost


RCM++ makes it possible to simulate the operation of the equipment with different potential maintenance strategies in order to estimate the expected failures for each scenario and calculate the Average Availability, Cost per Uptime and Total Operating Cost.

Failure Modes and Reliability Analysis (FMRA)


Failure modes and reliability analysis (FMRA) feature helps you to integrate statistical reliability analysis calculations into your FMEA and RCM activities. It can be used to:

  • Display the FMEA records that could have an impact on system reliability/maintainability to define the relevant reliability characteristics.
  • Calculate the probabilities of failure required for a quantitative criticality analysis.
  • Use the occurrence ratings to generate a preliminary baseline reliability estimate.
  • Synchronize with BlockSim’s reliability block diagrams (RBDs) or fault trees.
  • Allocate the target reliability and target availability.


Optimum replacement interval


Automatically calculate the optimum replacement interval that will minimize corrective and preventive maintenance costs. You can calculate the optimum time for an individual item, or to calculate a time that will be optimum for a specified group of items.

Queries, reports, charts and diagrams


The software provides a complete range of options for presenting the data in ways that will effectively communicate results and facilitate decision-making:

  • Queries and print-ready reports to manage predefined and customized templates that can be made available to all database users, applied to any data set and incorporated into any print-ready report document.
  • The Query Utility window is a powerful analysis tool that makes it easy to find and open specific sections of the analysis. It is also a flexible custom reporting tool that allows you to create and manage saved queries.
  • The Reports window makes it easy to build report documents that include the predefined report forms, custom report forms and/or custom queries that will be most effective to present your analysis results. Since you can generate these documents directly in Microsoft Word or Excel, it is easy to customize and distribute reports without a specialized report editor or viewer.

If your organization chooses to implement SEP – web portal for ReliaSoft applications for an enterprise database, you can also publish these reports to the portal (in Word, Excel, PDF or MHTML format), where they can be accessed from any web-enabled device:

  • The Plot Viewer provides an array of flexible options to create attractive bar charts, pie charts and matrix charts based on the analysis data. The software also generates Cause and Effect Diagrams and Failure Relationship Diagrams to help you visualize the relationships between issues in your analyses.
  • FMEA/FMRA dashboards, where you can create customized dashboards to present data from FMEA and FMRA analyses in XFMEA/RCM++. In addition, if your organization chooses to implement a web-based portal for an enterprise database, you can now share selected dashboards to be accessed from any web-enabled device.

Data management tools and utilities


The software provides an array of tools to help you find and reuse descriptions from any existing analysis and to select phrases from predefined templates or phrase libraries. You also can use fully customizable Excel® templates to quickly import system configurations and/or analysis data from external data sources. You have an ability to import system configuration data from XFMEAMPC and XFRACAS as well.

FRACAS integration


You can automatically import system configuration data from an external Bill of Materials file or from XFRACAS (web-based FRACAS software). For an enterprise database, you can maintain a direct link to the XFRACAS system, which makes it easy to resynchronize at any time. This connection also enables the FMEA team to tap into valuable information about failure modes that are observed during testing and in the field, including incident quantities and new failure modes that may not have been considered yet.