arrow_back_ios

Main Menu

See All ソフトウェア See All 計測器 See All トランスデューサ See All 振動試験装置 See All 電気音響 See All 音響エンドオブライン試験システム See All アプリケーション See All インダストリーズ See All キャリブレーション See All エンジニアリングサービス See All サポート
arrow_back_ios

Main Menu

See All 解析シミュレーション See All DAQ See All APIドライバ See All ユーティリティ See All 振動コントロール See All 校正 See All DAQ See All ハンドヘルド See All 産業 See All パワーアナライザ See All シグナルコンディショナー See All 音響 See All 電流電圧 See All 変位 See All 力 See All ロードセル See All マルチコンポーネント See All 圧力 See All ひずみ See All ひずみゲージ See All 温度 See All チルト See All トルク See All 振動 See All アクセサリ See All コントローラ See All 測定加振器 See All モーダル加振器 See All パワーアンプ See All 加振器システム See All テストソリューション See All アクチュエータ See All 内燃機関 See All 耐久性 See All eDrive See All 生産テストセンサ See All トランスミッションギアボックス See All ターボチャージャ See All アコースティック See All アセット&プロセスモニタリング See All 電力 See All NVH See All OEMカスタムセンサ See All 構造的な整合性 See All 振動: See All 自動車・陸上輸送 See All 圧力校正|センサー|振動子 See All 校正・修理のご依頼 See All キャリブレーションとベリフィケーション See All キャリブレーション・プラス契約 See All サポート ブリュエル・ケアー
arrow_back_ios

Main Menu

See All nCode - 耐久性および疲労解析 See All ReliaSoft - 信頼性解析と管理 See All API See All 電気音響 See All 環境ノイズ See All 騒音源の特定 See All 製品ノイズ See All 音響パワーと音圧 See All 自動車通過騒音 See All 生産テストと品質保証 See All 機械分析・診断 See All 構造物ヘルスモニタリング See All バッテリーテスト See All 過渡現象時の電力測定入門 See All トランスの等価回路図|HBM See All アグリ業界向けOEMセンサー See All ロボティクスとトルクアプリケーション用OEMセンサー See All 構造ダイナミクス See All 材料特性試験 See All pages-not-migrated See All ソフトウェアライセンス管理

Reliability Phase Diagrams

What are reliability phase diagrams?


Reliability Phase Diagrams, or RPDs, can be thought of as an extension of the Reliability Block Diagram (RBD) approach. RPDs graphically describe the sequence of different operational and/or maintenance phases experienced by a system. This means that, unlike an RBD which is limited to systems with fixed configurations, RPDs can be used to represent complex systems that may change over time. The change may be in the reliability configurations (i.e. the RBD) and/or other properties, such as the availability of resources or throughput properties. In this article, we will use ReliaSoft BlockSim to illustrate the use of reliability phase diagrams to study a complex system.

In complex systems, each stage during a mission can be represented by a phase block. The properties of the phase block are inherited from an RBD corresponding to the system's reliability configuration in that phase, along with any associated resources of the system during that time. A reliability phase diagram is then a series of such phase blocks connected in chronological order.

Using BlockSim for phase analysis with complex diagrams


Consider a process where a robot manipulator is used. Because the system operates in a remote location and stopping the operation is costly, individual components that fail but do not cause a system failure are not repaired immediately. The failed components are repaired only during the scheduled yearly maintenance of the entire operation. System failures, however, are given immediate attention, and these repairs are costly, time-consuming and incur additional warranty costs per hour of downtime. The robot manipulator is warranted for 5 years. The goal of the analysis is to determine the warranty costs incurred by the system. In order to accomplish this, three metrics are of interest: the expected number of failures of the system, the system downtime associated with unplanned system failures and the expected number of component replacements during the yearly maintenance.

Reliability phase diagram


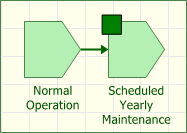
Representing the robot system with a single RBD would result in limitations. For example, a corrective repair of a component that is due to a system failure needs to be handled differently than a corrective repair performed during the yearly maintenance because they incur different costs. Therefore, the following RPD will be used.

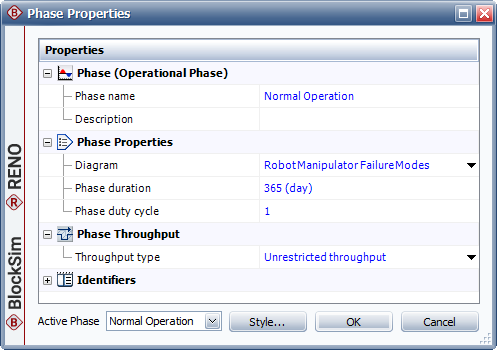
Figure 1 shows the properties of each phase.
 
Figure 1: Phase properties for the robot manipulator system RPD

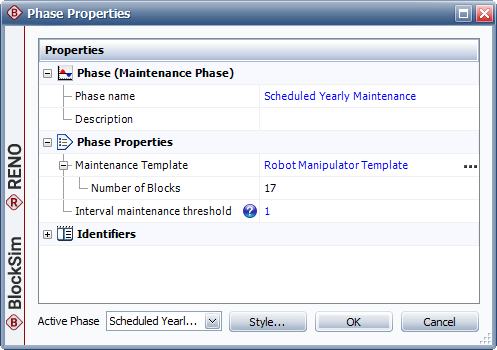
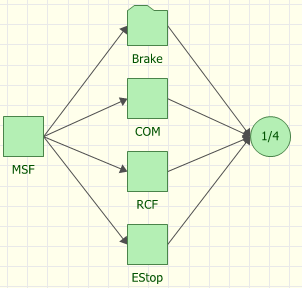
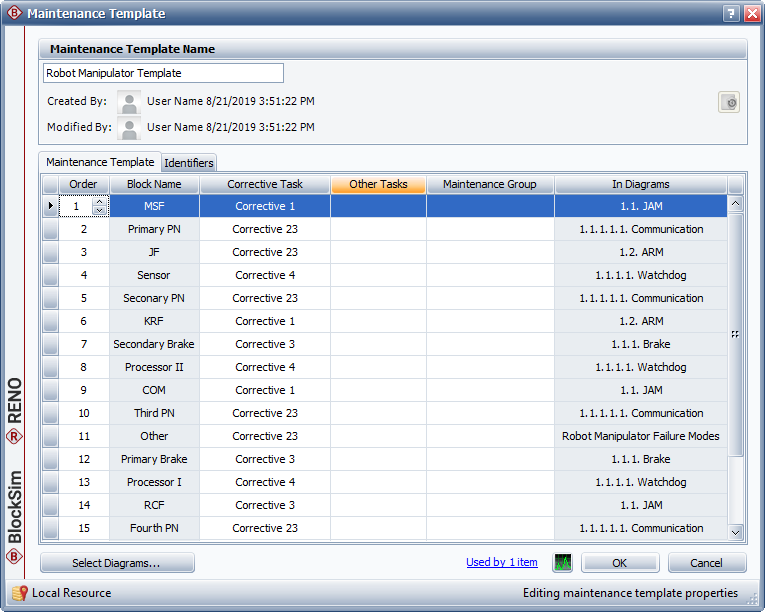
By using two phases to represent the system, we segregate the results obtained from different stages (normal vs. yearly maintenance) as well as any input variations. The normal operation phase represents the system while in operation. In this phase, blocks that fail but do not bring down the system are not repaired upon failure but remain down until the scheduled yearly maintenance. However, the failure of a block that causes a system failure will result in the repair of that block as well as a repair of all other failed components. The Normal Operation phase inherits its properties from an RBD representing the system (Figure 2). Meanwhile, the Scheduled Yearly Maintenance phase represents the portion of the mission time when the system is brought down each year so that maintenance actions can be performed on some or all of its components. In BlockSim, a maintenance phase block is defined by, and linked to, a maintenance template. This template is a list of the specific components (blocks) that are designated to undergo inspection, repair or replacement actions during the maintenance phase (Figure 3).

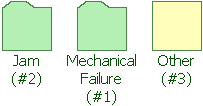
Robot manipulator failure modes
Jam subdiagram
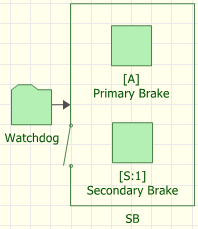
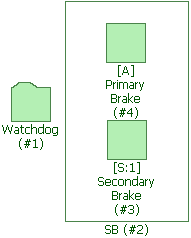
Brake subdiagram
Watchdog subdiagram
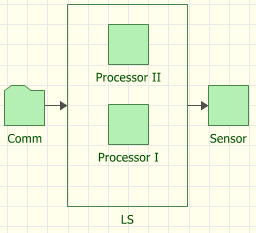
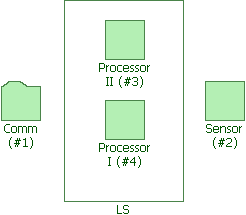
Comm subdiagram
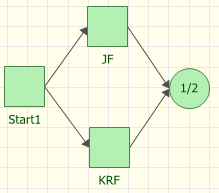
Mechanical failure subdiagram
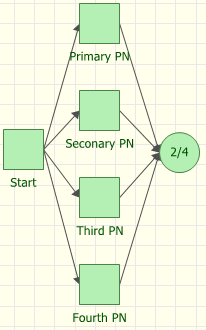
Figure 2: Robot manipulator system diagram and subdiagrams
Figure 3: Maintenance template associated with the Scheduled Yearly Maintenance phase block

Analysis


Table 1 gives the failure and repair inputs of the system.

Block name Failure distribution
normal operation
(in days)
Repair distribution
normal operation
(in days)
Repair distribution
yearly maintenance
(in days)
JF WBL(Beta=4, Eta=6000) EXP(Mean=12) EXP(Mean=3)
KRF WBL(Beta=2, Eta=7000) EXP(Mean=12) EXP(Mean=4)
COM EXP(Mean=5000) EXP(Mean=16) EXP(Mean=4)
EStop EXP(Mean=4000) EXP(Mean=14) EXP(Mean=2)
MSF WBL(Beta=3, Eta=10000) EXP(Mean=13) EXP(Mean=4)
RCF EXP(Mean=5000) EXP(Mean=14) EXP(Mean=5)
Primary brake Cold standby, active distribution:
WBL(Beta=2, Eta=1000)
EXP(Mean=10) EXP(Mean=5)
Secondary brake Cold standby, active distribution:
WBL(Beta=2, Eta=1000)
EXP(Mean=10) EXP(Mean=5)
Processor I Load sharing, WBL-IPL:
Beta=1.5, K=2.38E-4, n=1.32)
EXP(Mean=9) EXP(Mean=2)
Processor II Load sharing, WBL-IPL:
(Beta=1.5, K=2.38E-4, n=1.32)
EXP(Mean=9) EXP(Mean=2)
Sensor EXP(Mean=5000) EXP(Mean=9) EXP(Mean=2)
Primary PN EXP(Mean=5000) EXP(Mean=12) EXP(Mean=3)
Secondary PN EXP(Mean=5000) EXP(Mean=12) EXP(Mean=3)
Third PN EXP(Mean=5000) EXP(Mean=12) EXP(Mean=3)
Fourth PN EXP(Mean=5000) EXP(Mean=12) EXP(Mean=3)
Other EXP(Mean=100000) EXP(Mean=15) EXP(Mean=3)
Table 1: Failure and repair properties
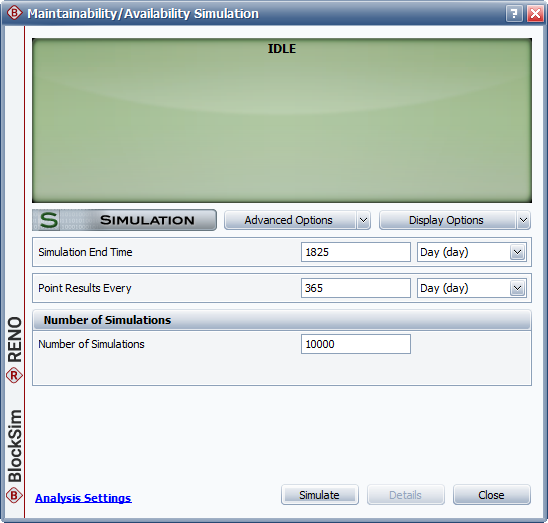
We can now run a simulation for the mission time of interest (5 years or 1825 days).
 
Figure 4: Simulation settings
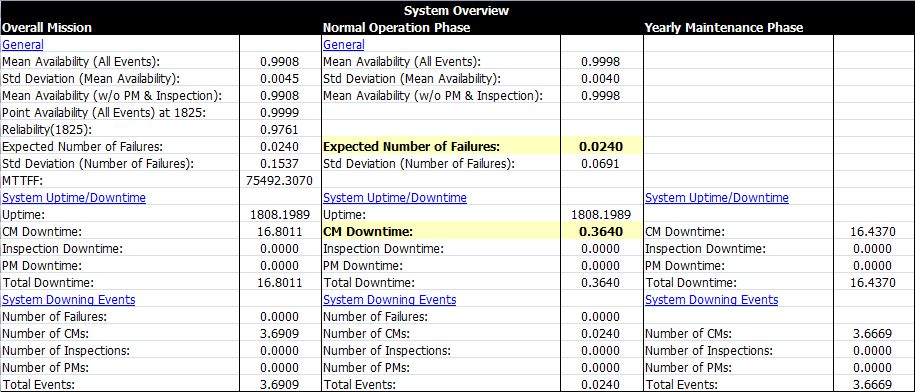
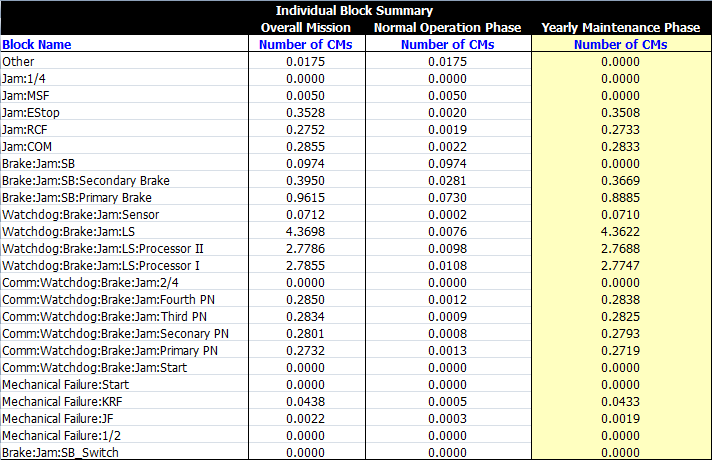
BlockSim provides multiple results at the overall mission level, as well as at the phase level. The results of interest are highlighted in Figures 5 and 6.
 
Figure 5: The expected number of failures and the component downtime associated with system failures
Figure 6: The expected number of component replacements during yearly maintenance

Conclusions


From the results we can conclude that the majority of the time (89.4%) our system should be running at 100% capacity and that after the 10-year period there is about a 5.3% chance that the system will degrade to a point from which it cannot be restored (the salvage state).