arrow_back_ios

Main Menu

See All ソフトウェア See All 計測器 See All トランスデューサ See All 振動試験装置 See All 電気音響 See All 音響エンドオブライン試験システム See All アプリケーション See All インダストリーズ See All キャリブレーション See All エンジニアリングサービス See All サポート
arrow_back_ios

Main Menu

See All 解析シミュレーション See All DAQ See All APIドライバ See All ユーティリティ See All 振動コントロール See All 校正 See All DAQ See All ハンドヘルド See All 産業 See All パワーアナライザ See All シグナルコンディショナー See All 音響 See All 電流電圧 See All 変位 See All 力 See All ロードセル See All マルチコンポーネント See All 圧力 See All ひずみ See All ひずみゲージ See All 温度 See All チルト See All トルク See All 振動 See All アクセサリ See All コントローラ See All 測定加振器 See All モーダル加振器 See All パワーアンプ See All 加振器システム See All テストソリューション See All アクチュエータ See All 内燃機関 See All 耐久性 See All eDrive See All 生産テストセンサ See All トランスミッションギアボックス See All ターボチャージャ See All アコースティック See All アセット&プロセスモニタリング See All 電力 See All NVH See All OEMカスタムセンサ See All 構造的な整合性 See All 振動: See All 自動車・陸上輸送 See All 圧力校正|センサー|振動子 See All 校正・修理のご依頼 See All キャリブレーションとベリフィケーション See All キャリブレーション・プラス契約 See All サポート ブリュエル・ケアー
arrow_back_ios

Main Menu

See All nCode - 耐久性および疲労解析 See All ReliaSoft - 信頼性解析と管理 See All API See All 電気音響 See All 環境ノイズ See All 騒音源の特定 See All 製品ノイズ See All 音響パワーと音圧 See All 自動車通過騒音 See All 生産テストと品質保証 See All 機械分析・診断 See All 構造物ヘルスモニタリング See All バッテリーテスト See All 過渡現象時の電力測定入門 See All トランスの等価回路図|HBM See All アグリ業界向けOEMセンサー See All ロボティクスとトルクアプリケーション用OEMセンサー See All 構造ダイナミクス See All 材料特性試験 See All pages-not-migrated See All ソフトウェアライセンス管理

Modeling Failure Modes (Fault Trees)

In the Modeling Failure Modes (RBDs) example, we used a reliability block diagram (RBD) approach to analyze a component and its associated failure modes. In this example, we will use the same component and conditions described in the Modeling Failure Modes (RBDs) example, but use a fault tree diagram instead of an RBD to perform the analysis.

Example


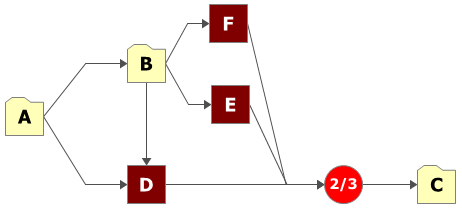
The component can fail due to six independent primary failure modes: A, B, C, D, E and F. The component fails if mode A, B or C occurs. If mode D, E or F occurs alone, the component does not fail; however, the component will fail if any two (or more) of these modes occur (i.e., D and E; D and F; E and F). Furthermore, modes A, B and C can be broken down further into the events (sub-modes) that can cause them. Once a mode occurs, its sub-mode also occurs and does not go away.


The following RBD illustrates the relationship between the primary modes.

Figure 1: RBD of Component
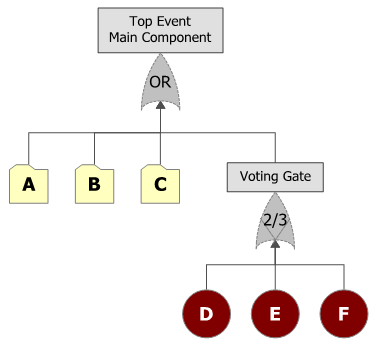
The following diagram shows the corresponding fault tree of the component. The voting gate, represented by 2/3, replaces the node in the RBD. The vote number in the voting gate is set to 2, which indicates that at least 2 of the 3 basic events must occur for the component to fail.
Figure 2: Fault Tree Diagram of Component

Mode A


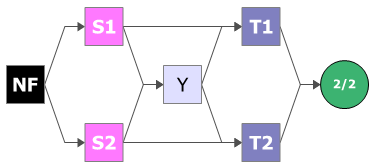
There are five independent (i.e., if one mode occurs, the rest are not more likely to occur) sub-modes associated with mode A: events S1, S2, T1, T2 and Y. There are three possible ways for mode A to manifest itself:


  • Events S1 and S1 both occur.
  • Event T1 or T2 occurs.
  • Event Y and either event S1 or event S2 occur (i.e., events Y and S1 or events Y and S2).

The following RBD illustrates the conditions for mode A.

Figure 3: RBD of Mode A

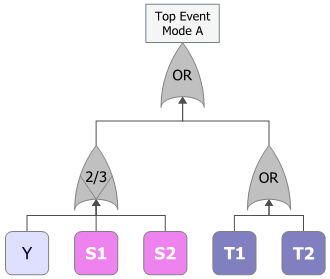
The following diagram shows the corresponding fault tree for mode A. The vote number in the voting gate is set to 2, indicating that at least 2 of the 3 conditional events must occur for mode A to occur.

Figure 4: Fault Tree of Mode A

Mode B


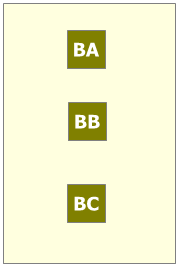
There are three dependent sub-modes associated with mode B: events BA, BB and BC. Two out of the three events must occur for mode B to occur. Specifically, when one event occurs, the MTTF of the remaining events is cut in half. This describes a load sharing configuration. The reliability function for each block will change depending on the other events. Therefore, the reliability of each block is not only dependent on time, but also on the stress (load) that the block sees.


The following picture shows the RBD of mode B. The blocks representing the sub-modes are inside a load sharing container. The number of required paths in the load sharing container is set to 2, indicating that 2 out of the 3 contained events must occur for mode B to occur.

Figure 5: Load Sharing Container for Mode B

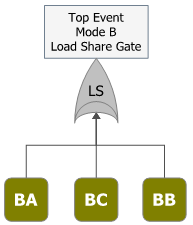
The following diagram shows the corresponding fault tree of mode B. The load sharing gate (LS) in the fault tree replaces the load sharing container in the RBD. The vote number in the load sharing gate is set to 2, indicating that at least 2 of the events must occur for mode B to occur.

Figure 6: Fault Tree Diagram of Mode B

The weight proportionality factor of each event is set to 1, indicating that they will share the load evenly (33.33% of the load each) when all are operating. If one fails, the other two will take over the load.


Note that a load sharing gate is not a standard fault tree gate. BlockSim introduces this gate to allow for representation of dependent events in a fault tree diagram. It behaves in exactly the same way as a load sharing container in an RBD.

Mode C


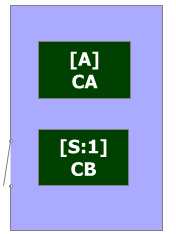
There are two sequential sub-modes associated with mode C: events CA and CB. Both events must occur for mode C to occur. Event CB will occur only if event CA has occurred. If event CA has not occurred, then event CB will not occur.


This scenario is similar to standby redundancy. Basically, if CA occurs then CB gets initiated. The following picture shows the RBD of mode C. The blocks representing the sub-modes are inside a standby container. The operation of block CA is set to Active, while the operation of block CB is set to Standby.

Figure 7: Standby Container for Mode C

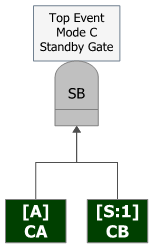
The following diagram shows the corresponding fault tree of mode C. The standby gate (SB) in the fault tree replaces the standby container in the RBD.

Figure 8: Fault Tree Diagram of Mode C

Discussion


If you use the same universal reliability definitions (URDs) that were defined in Example 2, the results of the fault tree diagram analysis will be the same as the results obtained by the RBD approach.


BlockSim has many options for modeling a system. The following figure illustrates an alternative fault tree diagram for the component.

Figure 9: Fault Tree Diagram of the Component Without Using Subdiagrams
In addition, you can use a combination of fault trees and RBDs in an analysis. For example, you can use fault trees as subdiagrams in an RBD, and vice versa.
Figure 10: Fault Trees as Subdiagrams in an RBD