arrow_back_ios

Main Menu

See All ソフトウェア See All 計測器 See All トランスデューサ See All 振動試験装置 See All 電気音響 See All 音響エンドオブライン試験システム See All アプリケーション See All インダストリーズ See All キャリブレーション See All エンジニアリングサービス See All サポート
arrow_back_ios

Main Menu

See All 解析シミュレーション See All DAQ See All APIドライバ See All ユーティリティ See All 振動コントロール See All 校正 See All DAQ See All ハンドヘルド See All 産業 See All パワーアナライザ See All シグナルコンディショナー See All 音響 See All 電流電圧 See All 変位 See All 力 See All ロードセル See All マルチコンポーネント See All 圧力 See All ひずみ See All ひずみゲージ See All 温度 See All チルト See All トルク See All 振動 See All アクセサリ See All コントローラ See All 測定加振器 See All モーダル加振器 See All パワーアンプ See All 加振器システム See All テストソリューション See All アクチュエータ See All 内燃機関 See All 耐久性 See All eDrive See All 生産テストセンサ See All トランスミッションギアボックス See All ターボチャージャ See All アコースティック See All アセット&プロセスモニタリング See All 電力 See All NVH See All OEMカスタムセンサ See All 構造的な整合性 See All 振動: See All 自動車・陸上輸送 See All 圧力校正|センサー|振動子 See All 校正・修理のご依頼 See All キャリブレーションとベリフィケーション See All キャリブレーション・プラス契約 See All サポート ブリュエル・ケアー
arrow_back_ios

Main Menu

See All nCode - 耐久性および疲労解析 See All ReliaSoft - 信頼性解析と管理 See All API See All 電気音響 See All 環境ノイズ See All 騒音源の特定 See All 製品ノイズ See All 音響パワーと音圧 See All 自動車通過騒音 See All 生産テストと品質保証 See All 機械分析・診断 See All 構造物ヘルスモニタリング See All バッテリーテスト See All 過渡現象時の電力測定入門 See All トランスの等価回路図|HBM See All アグリ業界向けOEMセンサー See All ロボティクスとトルクアプリケーション用OEMセンサー See All 構造ダイナミクス See All 材料特性試験 See All pages-not-migrated See All ソフトウェアライセンス管理

Markov Diagrams

What are Markov diagrams?


Markov diagrams allow you to model the behavior of a system in various states using a memoryless process, where the next state of the system is only dependent on the transition values and the current state of the system. This gives you the ability to look at partial or degraded working states, and to start analysis in varying states. Markov diagrams are available in ReliaSoft BlockSim software. If you have access to the Event Analysis module in BlockSim, you can analyze a Markov diagram during a simulation and use the analysis result in your RENO flowchart.

Using Markov Diagrams in ReliaSoft BlockSim for Reliability Analysis


With BlockSim, we will demonstrate an initial estimation analysis on the life cycle of a complex drilling system that starts off as brand new (100% initial probability in the full capacity state). The system has a probability to degrade into various states of capacity with time and can eventually enter a salvage state. There is also a probability of being returned to the as-good-as-new condition from each degraded state, except from the salvage state. The salvage state is considered to be a "sink," a state from which there are no transitions to any other state and therefore we have zero probability of leaving. We want to determine, on average, what percent of the time will be spent in each state over a 10-year period. To perform this type of analysis, we will use a discrete Markov diagram. Our initial setup looks like this:

We estimate the following probabilities per month to move between states:

  • 1% chance to degrade from 100% to 80% capacity
  • 10% chance to be restored from 80% to 100% capacity
  • 3% chance to degrade from 80% to 60% capacity
  • 8% chance to be restored from 60% to 100% capacity
  • 6% chance to degrade from 60% to 40% capacity
  • 5% chance to be restored from 40% to 100% capacity
  • 8% chance to degrade from 40% capacity to salvage

Based on these percentages, the final diagram that is ready for analysis looks like this:

Since our estimated probabilities are on a month scale, we will take each step of the analysis to be the equivalent of one month. This means that we will run our calculation for 120 steps. After we calculate the diagram, we can see that the transition probability matrix between the states looks like this (which we can easily use to verify our inputs):

Full Diagram
FROM -> TO 100% capacity 80% capacity 60% capacity 40% capacity Salvage
100% capacity 0.99 0.01 0 0 0
80% capacity 0.1 0.87 0.03 0 0
60% capacity 0.08 0 0.86 0.06 0
40% capacity 0.05 0 0 0.87 0.08
Salvage 0 0 0 0 1
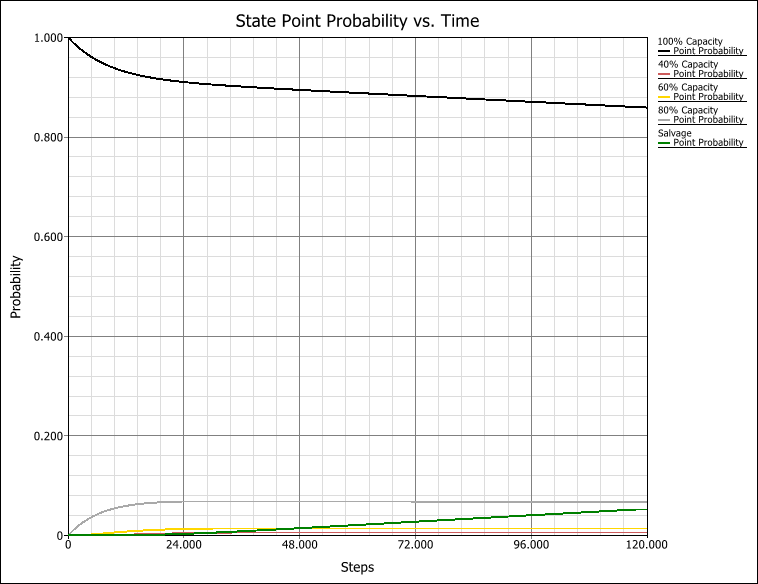
We can use the state point probability plot to see if our system has reached steady state within our time frame.

In this case study example, because we have a "sink" state, we do not reach steady state, where all the probabilities have reached a constant value, but rather a pseudo-steady state where the probabilities are changing at a roughly constant rate.


Afterwards, we can check the results summary to determine the mean probabilities in each state and the point probabilities after 120 steps (10 years).

Results After 120 Steps
State name Initial probability Mean probability Point probability Steps spent in state
100% capacity 1 0.894127 0.859252 107.295203
80% capacity 0 0.064845 0.066382 7.781451
60% capacity 0 0.013046 0.014282 1.565469
40% capacity 0 0.005597 0.00662 0.671615
Salvage 0 0.022386 0.053464 2.686261

Conclusions


From the results we can conclude that the majority of the time (89.4%) our system should be running at 100% capacity and that after the 10-year period there is about a 5.3% chance that the system will degrade to a point from which it cannot be restored (the salvage state).