arrow_back_ios
Main Menu
arrow_back_ios
Main Menu
- Acústica
- Tensão e Corrente
- Deslocamento
- Força
- Células de carga
- Multicomponente
- Pressão
- Deformação
- Strain Gauges
- Temperatura
- Inclinação
- Torque
- Vibração
- Acessórios
- Controladores
- Excitadores de medição
- Excitadores modais
- Amplificadores de potência
- Sistemas Shaker
- Acessórios de Aplicação eletroacústica
- Ouvido artificial
- Boca artificial
- Condução óssea
- Aquisição de dados
- Simulador de cabeça e torso HATS
- Microfone
- Condicionamento de sinal
- Soluções de teste
- Acessórios
- Atuadores
- Motores de combustão
- Durabilidade
- eDrive
- Sistemas móveis
- Sensores de teste de produção
- Caixas de transmissão
- Turbo Charger
arrow_back_ios
Main Menu
- Software de controle de vibração
- Aleatório
- Classical Shock
- Replicação da forma de onda temporal
- Sine-on-Random
- Random-On-Random
- Síntese do espectro de resposta ao choque
- Sonômetro
- Medidores de vibração
- Medidores de intensidade sonora
- Dosímetros de ruído
- Software
- Acessórios
- Sistemas multicanais
- Sistema de canal simples
- Piezoelectric Paceline
- Controladores Press Fit
- Amplificadores com display
- Legal for Trade
- Acessórios
- Cartuchos de microfone
- Pré-amplificadores de microfone
- Conjuntos de microfones
- Hidrofones
- Fontes sonoras
- Calibradores
- Microfones especiais
- Acessórios
- Acelerômetros de carga
- Acelerômetros CCLD
- Transdutores de força
- Acelerômetros de referência
- Sondas de tacômetro
- Calibradores
- Acelerômetros ópticos
- Acessórios
- Descontinuado
- Unidade de centralização estática DC
- Fontes de alimentação de campo
- Cabos
- Pinhões
- Suportes de excitação
- Acústica e vibração
- Monitoramento de ativos e processos
- Data Acquisiton
- Teste de energia elétrica
- Ensaios de fadiga e durabilidade
- Ensaio mecânico
- Confiabilidade
- Pesagem
- Ruído do produto
- Teste de ruído de rampa
- Certificação do ruído estático do motor
- Certificação de voo
- Ruído de passagem de veículos
- Electroacoustics
- Identificação da fonte de ruído
- Ruído ambiental
- O que é potência sonora e pressão sonora
- Certificação de ruído
- Teste de Material Acústico
- Teste de produção e garantia de qualidade
- Análise e Diagnóstico de Máquinas
- Monitoramento de integridade estrutural
- Testes de quadros de distribuição
- Alta tensão
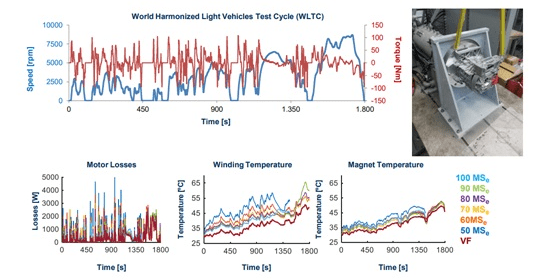
- Teste de trem de força
- Teste de bateria
- Teste de máquinas elétricas | Teste de Powertrain | HBM
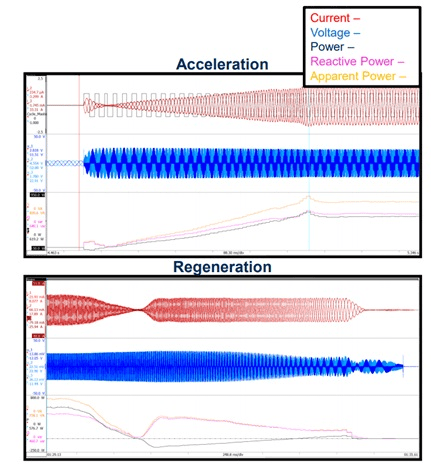
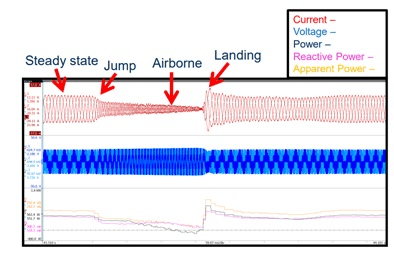
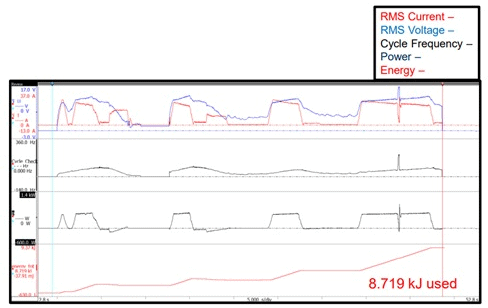
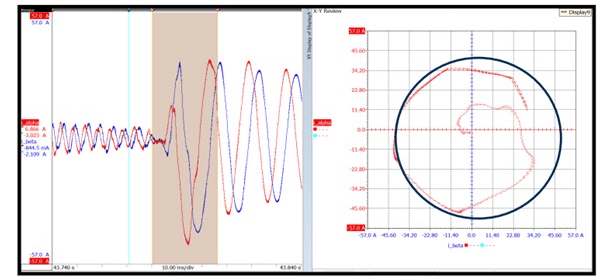
- Introdução à Medição de Energia Elétrica Durante Transitórios
- Diagrama de circuito equivalente do transformador | HBM
- Teste zero atual
- Conjuntos de sensores personalizados OEM para eBikes
- Conjuntos de sensores personalizados OEM para a indústria agrícola
- OEM Custom Sensor Assemblies para aplicações médicas
- Conjuntos de sensores personalizados para OEM de robótica
- Sensores OEM para a indústria agrícola
- Sensores OEM para aplicações robóticas e de torque
- Sensores médicos OEM
- Teste de Durabilidade - Teste de Fadiga
- Teste de choque e queda
- Teste de embalagens / Vibração de transporte
- Triagem de Estresse Ambiental - ESS
- Qualificação de Satélites Mecânicos
- Zumbido, chiado e chocalho (BSR)
- Teste de bateria de veículos elétricos e híbridos
arrow_back_ios
Main Menu
- Testing Of Hands-Free Devices
- Smart Speaker Testing
- Teste de alto-falante
- Teste de aparelhos auditivos
- Teste de auscultadores
- Testes de fones de ouvido e telefones
- Perguntas
- Holografia acústica
- Variação acústica subaquática
- Teste acústico de túnel de vento – Aerospace
- Ensaios em túnel de vento para automóveis
- Beamforming
- Identificação da fonte de ruído
- Identificação de fontes de ruído em tempo real com câmara acústica
- Medidores de intensidade sonora
- Formação de feixe esférico
- PRODUCT NOISE
- Sistema de Medição Acústica
- Acústica de salas e edifícios
- Sistema de medição arquitetónica
- Ruído no local de trabalho
- Poluição sonora urbana
- Potência sonora baseada na intensidade do som
- Pressão sonora - Reverberação Potência sonora baseada na sala
- Certificação de ruído estático do motor
- Ruído Pass-by de Veículos
- Ensaio de ruído de rampa
- Certificação de Voo
- Análise de Pedidos
- Diagnóstico de Máquinas
- Sistemas de monitoramento de integridade e uso (HUMS)
- Teste de turbinas a gás
- Perguntas para análise de máquinas
- Monitoramento de túneis com sensores Fiber Bragg
- Soluções de monitoramento para infraestruturas civis
- Soluções de monitoramento para turbinas eólicas
- Soluções de monitorização para a indústria do petróleo e do gás
- Soluções de monitoramento para ferrovias
- Soluções de monitoramento para engenharia civil
- Serviços de monitoramento disponíveis
- Monitorização de fundações utilizando extensómetros