arrow_back_ios

Main Menu

See All ソフトウェア See All 計測器 See All トランスデューサ See All 振動試験装置 See All 電気音響 See All 音響エンドオブライン試験システム See All アプリケーション See All インダストリーズ See All キャリブレーション See All エンジニアリングサービス See All サポート
arrow_back_ios

Main Menu

See All 解析シミュレーション See All DAQ See All APIドライバ See All ユーティリティ See All 振動コントロール See All 校正 See All DAQ See All ハンドヘルド See All 産業 See All パワーアナライザ See All シグナルコンディショナー See All 音響 See All 電流電圧 See All 変位 See All 力 See All ロードセル See All マルチコンポーネント See All 圧力 See All ひずみ See All ひずみゲージ See All 温度 See All チルト See All トルク See All 振動 See All アクセサリ See All コントローラ See All 測定加振器 See All モーダル加振器 See All パワーアンプ See All 加振器システム See All テストソリューション See All アクチュエータ See All 内燃機関 See All 耐久性 See All eDrive See All 生産テストセンサ See All トランスミッションギアボックス See All ターボチャージャ See All アコースティック See All アセット&プロセスモニタリング See All 電力 See All NVH See All OEMカスタムセンサ See All 構造的な整合性 See All 振動: See All 自動車・陸上輸送 See All 圧力校正|センサー|振動子 See All 校正・修理のご依頼 See All キャリブレーションとベリフィケーション See All キャリブレーション・プラス契約 See All サポート ブリュエル・ケアー
arrow_back_ios

Main Menu

See All nCode - 耐久性および疲労解析 See All ReliaSoft - 信頼性解析と管理 See All API See All 電気音響 See All 環境ノイズ See All 騒音源の特定 See All 製品ノイズ See All 音響パワーと音圧 See All 自動車通過騒音 See All 生産テストと品質保証 See All 機械分析・診断 See All 構造物ヘルスモニタリング See All バッテリーテスト See All 過渡現象時の電力測定入門 See All トランスの等価回路図|HBM See All アグリ業界向けOEMセンサー See All ロボティクスとトルクアプリケーション用OEMセンサー See All 構造ダイナミクス See All 材料特性試験 See All pages-not-migrated See All ソフトウェアライセンス管理

Warranty Analysis Example

A company keeps track of its shipments and warranty returns on a month-by-month basis. Using the Warranty Analysis folio, determine the parameters for a 2-parameter Weibull distribution and predict the number of products from each of the three shipment periods that will be returned under warranty in October.

Experiment and data


In June, 100 units are sold and in July, three are returned. This gives 3 failures at one month for the June shipment. Likewise, 3 failures occur in August and 5 occur in September for this shipment. Consequently, at the end of the three-month analysis period, there are a total of 11 failures for the 100 units shipped in June. This means that 89 units are presumably still operating and can be considered suspensions at three months.


For the shipment of 140 in July, 2 are returned the following month and 4 more are returned the month after that. After two months, there are 134 units from the July shipment still operating.


For the final shipment of 150 in August, 4 fail in September, with the remaining 146 units being suspensions at one month.


The shipment and returns data are shown in the following table.

Analysis


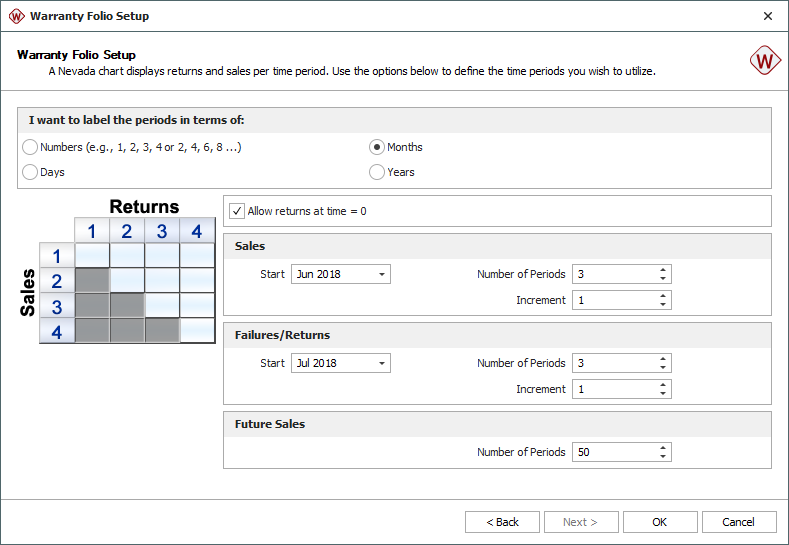
Step 1: Create a new warranty analysis folio using the Nevada data format. On the second page of the Warranty Folio Setup window, make the selections shown next.

Figure 1: Second page of the Warranty Folio Setup window for Nevada chart format folios
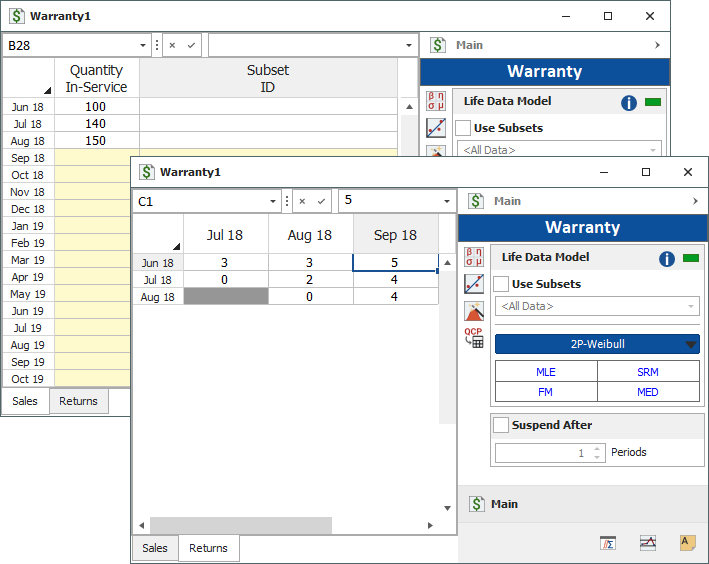
Step 2: Enter the shipments data on the Sales data sheet and the returns data on the Returns sheet. Then select the 2-parameter Weibull distribution with MLE. The folio will appear as shown next.
Figure 2: Warranty folio with data entered and calculation options selected

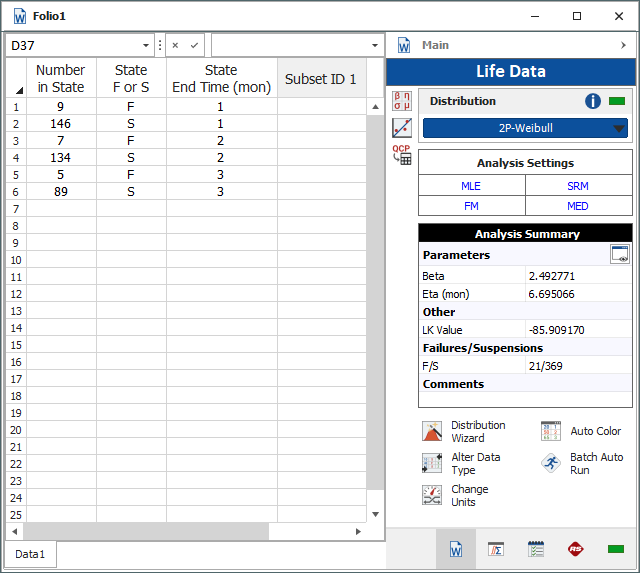
Step 3: Click Calculate. Weibull++ automatically converts the warranty data into failure/suspension times and estimates the parameters of the chosen distribution. The results are beta = 2.4928 and eta = 6.6951.


To show the converted failure/suspension data, choose Warranty > Transfer Life Data > Transfer Life Data to New Folio.

Figure 3: Standard folio with data entered and results shown

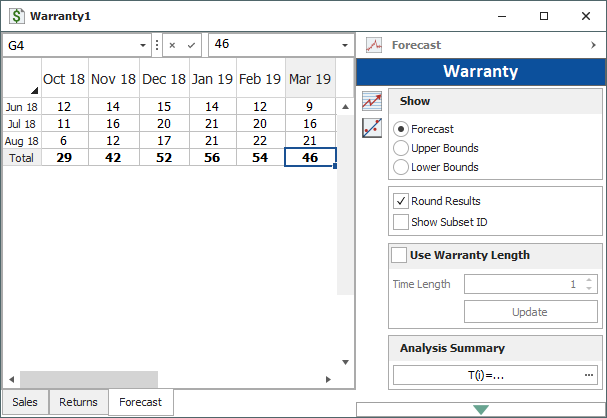
Step 4: Generate forecasts for the quantity of units that can be expected to be returned.


In the figure shown next, the Forecast data sheet shows the number of failures that can be expected from each shipment in upcoming months. For example, the predicted number of products that will be returned in October are 12 from the June shipment, 11 from the July shipment and 6 from the August shipment for a total of 29 returned units.

Figure 4: Forecast data sheet