A company keeps track of its shipments and warranty returns on a month-by-month basis. Using the Warranty Analysis folio, determine the parameters for a 2-parameter Weibull distribution and predict the number of products from each of the three shipment periods that will be returned under warranty in October.
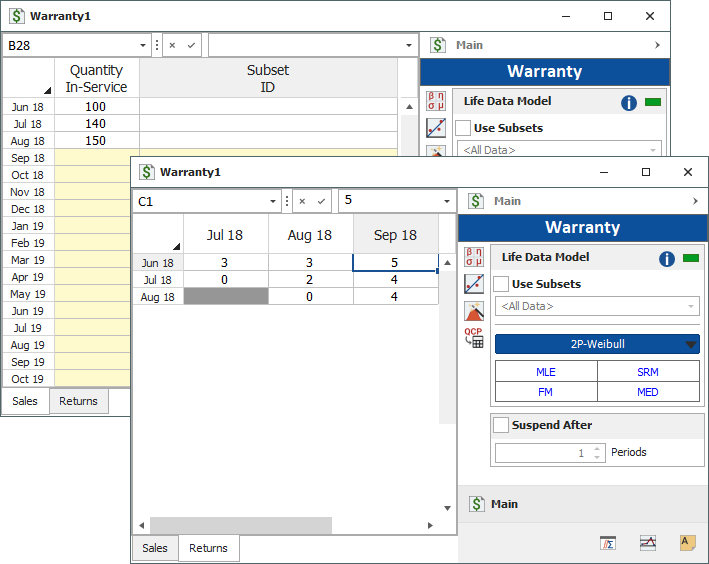
In June, 100 units are sold and in July, three are returned. This gives 3 failures at one month for the June shipment. Likewise, 3 failures occur in August and 5 occur in September for this shipment. Consequently, at the end of the three-month analysis period, there are a total of 11 failures for the 100 units shipped in June. This means that 89 units are presumably still operating and can be considered suspensions at three months.
For the shipment of 140 in July, 2 are returned the following month and 4 more are returned the month after that. After two months, there are 134 units from the July shipment still operating.
For the final shipment of 150 in August, 4 fail in September, with the remaining 146 units being suspensions at one month.
The shipment and returns data are shown in the following table.
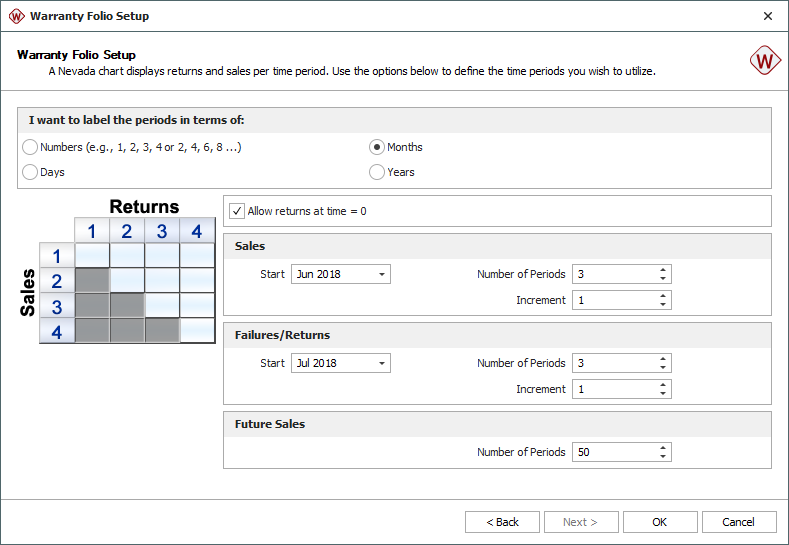
Step 1: Create a new warranty analysis folio using the Nevada data format. On the second page of the Warranty Folio Setup window, make the selections shown next.
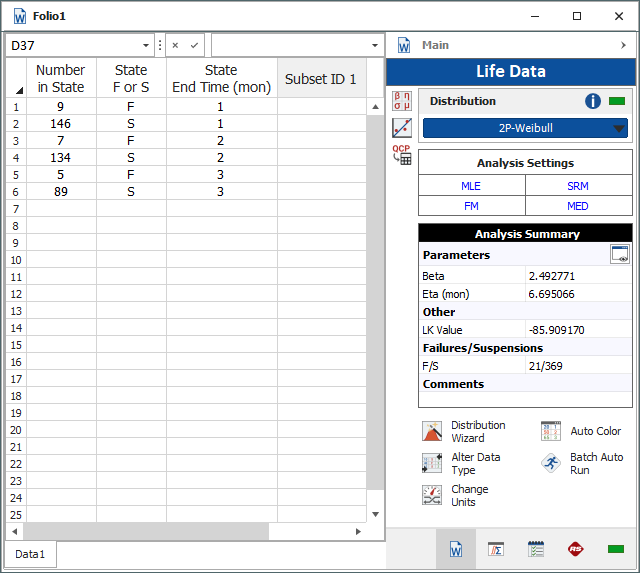
Step 3: Click Calculate. Weibull++ automatically converts the warranty data into failure/suspension times and estimates the parameters of the chosen distribution. The results are beta = 2.4928 and eta = 6.6951.
To show the converted failure/suspension data, choose Warranty > Transfer Life Data > Transfer Life Data to New Folio.
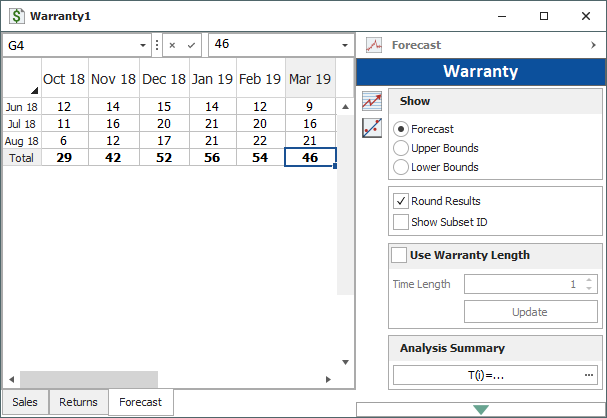
Step 4: Generate forecasts for the quantity of units that can be expected to be returned.
In the figure shown next, the Forecast data sheet shows the number of failures that can be expected from each shipment in upcoming months. For example, the predicted number of products that will be returned in October are 12 from the June shipment, 11 from the July shipment and 6 from the August shipment for a total of 29 returned units.