arrow_back_ios
Main Menu
arrow_back_ios
In ReliaSoft Lambda Predict, derating analysis is available only for systems analyzed with the MIL-217, Bellcore/Telcordia or FIDES prediction standards. In this example, we will analyze the effect of ambient temperature on a particular system.
The example file contains sample system configuration data for MIL-217, Bellcore/Telcordia and FIDES systems. You can open any of the sample projects, but only the systems that are analyzed with the prediction standard you have purchased will be displayed. To demonstrate derating analysis, we will use the MIL-217 system as an example. The instructions are generally the same for all systems (unless noted otherwise), so you can follow along with the example regardless of which system is available to you.
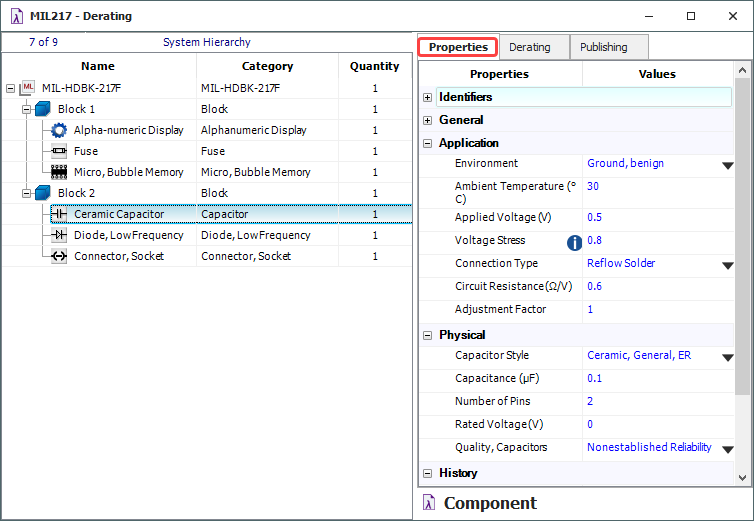
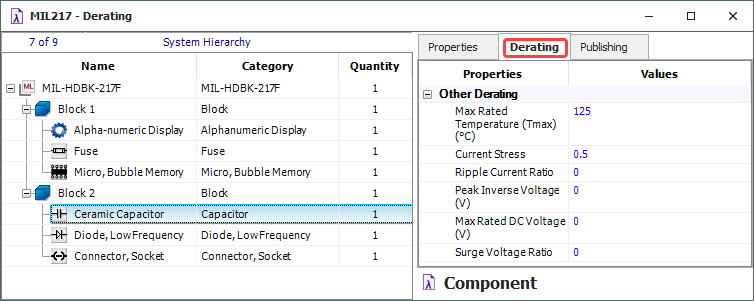
For each component that can be derated, the Properties tab shows the properties that will affect both the component's failure rate and derating, while the Derating tab shows additional properties that apply only to derating analysis. As an example, the following picture shows the properties of a ceramic capacitor in the MIL-217 system in the sample project.
Step 1: Before starting the analysis, we must configure the system hierarchy to display results from a derating analysis. To do this, right-click anywhere in the system hierarchy and then choose Customize Columns on the shortcut menu. In the window that appears, select the Derating Status and Derating check boxes, and then click OK to display those columns in the system hierarchy.
Step 2: In the prediction folio, select the top-level item and choose Prediction Tools > Derating > Apply Derating.
![]()
Select the NAVSEA derating standard from the drop-down list and click OK. The application will then automatically evaluate each component to determine whether it meets the requirements provided by the selected derating standard. The results are displayed in the Derating column, as shown next. (Note that any components of types not specified in the derating standard are not considered in the derating analysis.)
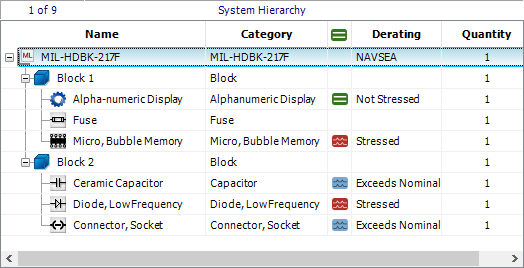
Aside from the results shown in the Derating column, icons are also displayed to indicate the status of the component:
![]() A green icon (Not Stressed) indicates that the component meets the derating requirements defined in the standard (i.e., the stress level and temperature fall within the nominal case curve).
A green icon (Not Stressed) indicates that the component meets the derating requirements defined in the standard (i.e., the stress level and temperature fall within the nominal case curve).
![]() A blue icon (Exceeds Nominal) indicates that the component does not meet the derating requirements, but it is not overstressed (i.e., the stress level and temperature fall outside the nominal case curve, but are within the worst case curve).
A blue icon (Exceeds Nominal) indicates that the component does not meet the derating requirements, but it is not overstressed (i.e., the stress level and temperature fall outside the nominal case curve, but are within the worst case curve).
![]() A red icon (Stressed) indicates that the component is overstressed according to the derating requirements (i.e., the stress level and temperature fall outside the worst case curve or, in the case of a component with only a nominal case curve defined, outside the nominal case curve).
A red icon (Stressed) indicates that the component is overstressed according to the derating requirements (i.e., the stress level and temperature fall outside the worst case curve or, in the case of a component with only a nominal case curve defined, outside the nominal case curve).
Notice that the capacitor displays the blue icon, indicating that the component, while not stressed now, is close to the stress limit.
Step 4: To plot the derating curves, select the capacitor and then choose Prediction Tools > Derating > View Component Derating.
![]()
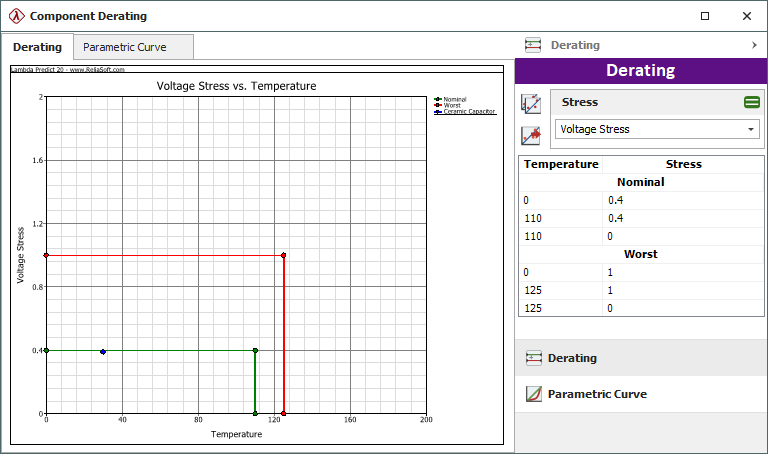
The following plot shows that the capacitor's voltage stress ratio (blue dot) is between the nominal curve (green curve) and the worst case curve (red curve). This means that the capacitor does not meet the derating requirements, but is not actually overstressed. From the plot, we can assume that altering the ambient temperature will not address the problem. Instead, the voltage stress must be reduced.
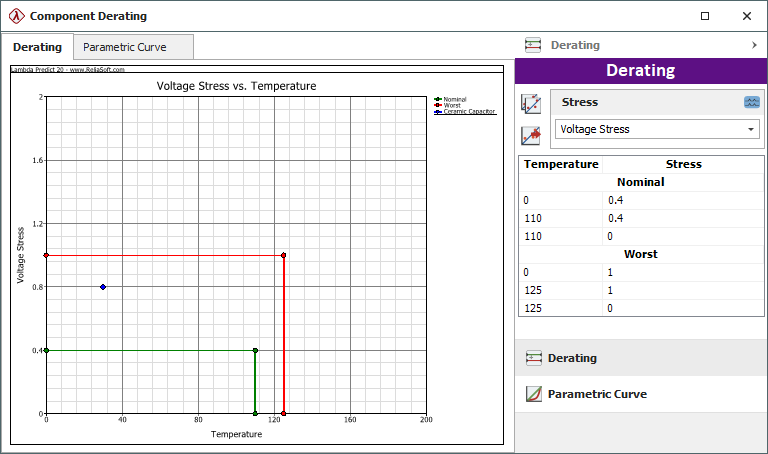
The information on the plot's control panel helps to give you an idea on what value would be appropriate for the capacitor's voltage stress. According to this data, the nominal voltage stress for a temperature range of 0 to 110 degrees is 0.4. (Note that these values may differ for the Telcordia and FIDES sample systems.)
Step 5: Close the Component Derating window and return to the prediction folio. Select the capacitor and, in the Properties panel, change the value of the Voltage Stress property from 0.8 to 0.39. Press ENTER or click outside the field to accept the change.
Notice how the capacitor's derating status icon has changed from blue to green. This means that the capacitor now meets the derating requirements and is no longer stressed.
Step 6: Plot the capacitor's derating curves again. This time, the plot shows that the voltage stress is within the nominal case curve, as shown below.