arrow_back_ios

Main Menu

See All 분석 및 시뮬레이션 소프트웨어 See All DAQ 소프트웨어 See All 드라이버 및 API See All 유틸리티 See All 진동 제어 See All 고정밀 및 보정 시스템 See All DAQ 시스템 See All S&V 핸드헬드 장치 See All 산업용 전자 제품 See All 전력 분석기 See All S&V 시그널 컨디셔너 See All 음향 트랜스듀서 See All 전류 및 전압 센서 See All 변위 센서 See All 힘 센서 See All 로드셀 See All 멀티 컴포넌트 센서 See All 압력 센서 See All 스트레인 센서 See All 스트레인 게이지 See All 온도 센서 See All 기울기 센서 See All 토크 센서 See All 진동 트랜스듀서 See All 진동 테스트 장비용 액세서리 See All 진동 컨트롤러 See All 측정 여기기 See All 모달 익사이터 See All 파워 앰프 See All LDS 셰이커 시스템 See All 테스트 솔루션 See All 액추에이터 See All 내연 엔진 See All 내구성 See All eDrive See All 생산 테스트 센서 See All 변속기 및 기어박스 See All 터보 충전기

릴리아소프트 애플리케이션용 웹 포털

Web dashboard for reliability analyses


Your personalized SEP home page features an intuitive, at-a-glance dashboard that presents the reliability results and tasks you’re tracking, such as metrics, assigned actions, recent messages, reports and more.

The flexible, web-based dashboard supports easy drag and drop to move and resize tiles (not limited to pre-set layouts) and the ability maximize any tile with the click of a button. You can choose from a gallery of tile types designed to showcase data from reliability analyses and tasks, with settings that are easy to configure to meet your personal preferences and needs.

FMEAs, queries and reports


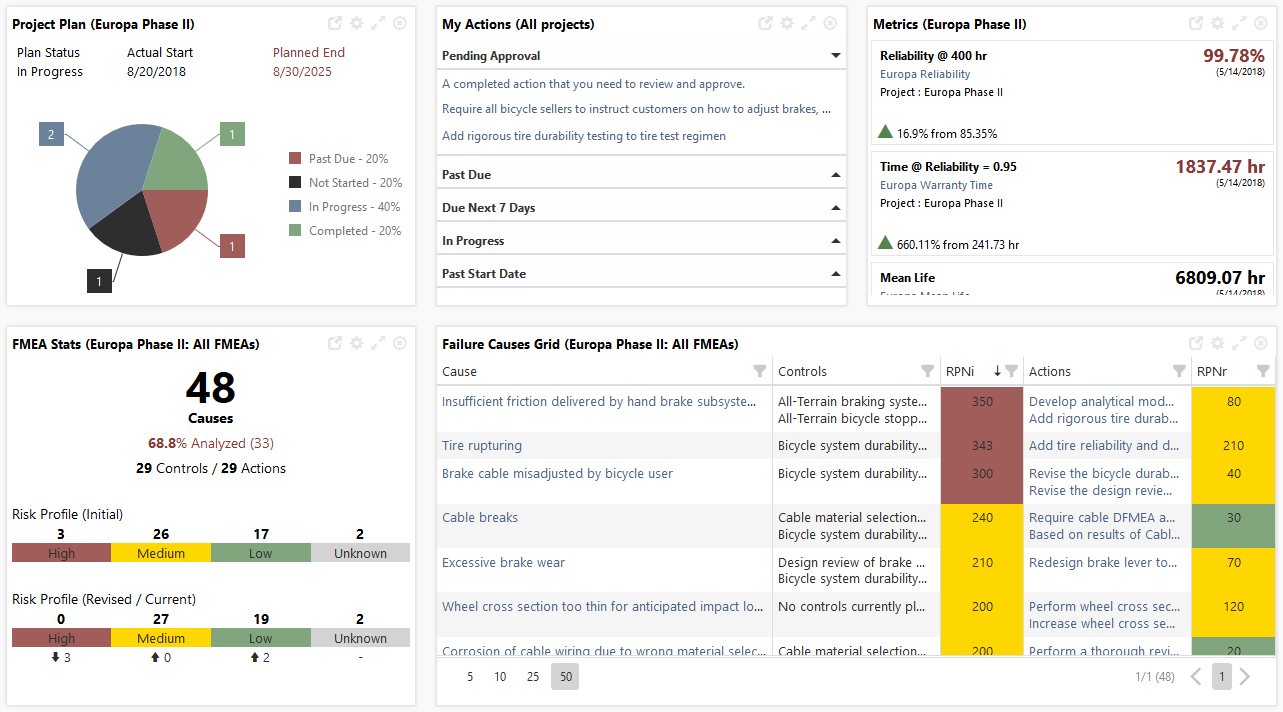
SEP provides convenient mobile access for managers and others throughout your organization to view the latest data from FMEAs performed in XFMEA/RCM++.

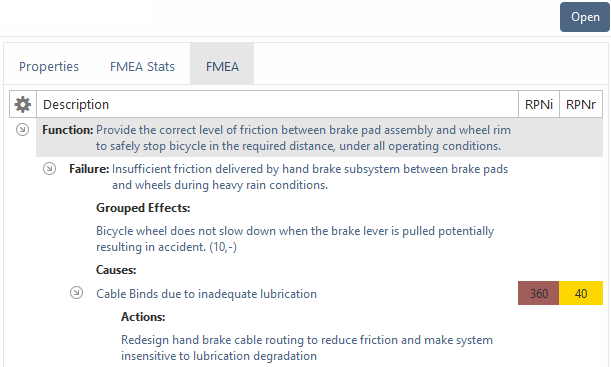
The website offers at-a-glance summaries to track progress for FMEA projects, top failure modes and the status of actions assigned to reduce risk, such as:

  • Priority highlights based on RPN, SxO or customized risk ranking
  • Quantity of functions and failure modes, with % analyzed
  • Top 10 failure modes
  • Assigned actions, with % complete, in progress, past due or not started
  • Change log status and the ability to approve versions assigned to you
  • Results from your own custom queries

Reliability analysis summaries and metrics


For selected reliability analyses performed in Weibull++BlockSim, or Lambda Predict, your team can publish summaries, plots or reports for access within SEP. Each user can choose the metrics, dashboards and reports they wish to monitor via the website.

Drill down to the full analysis


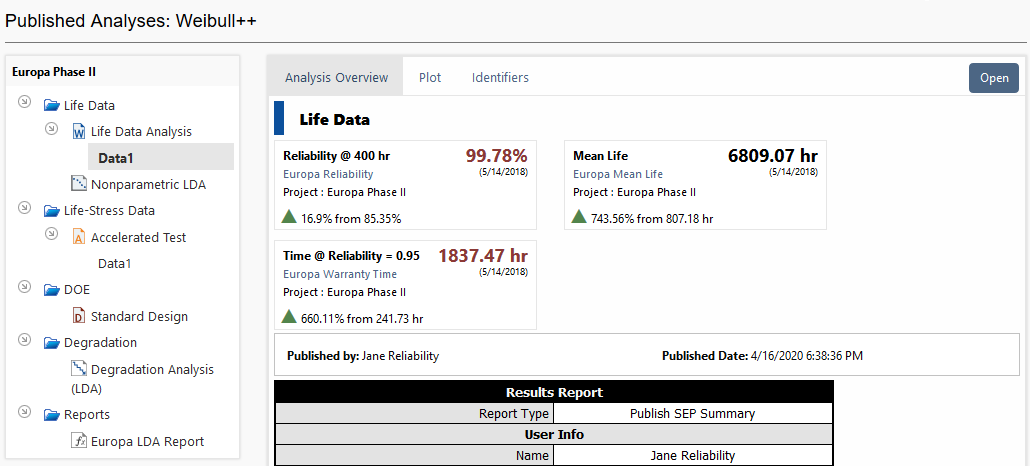
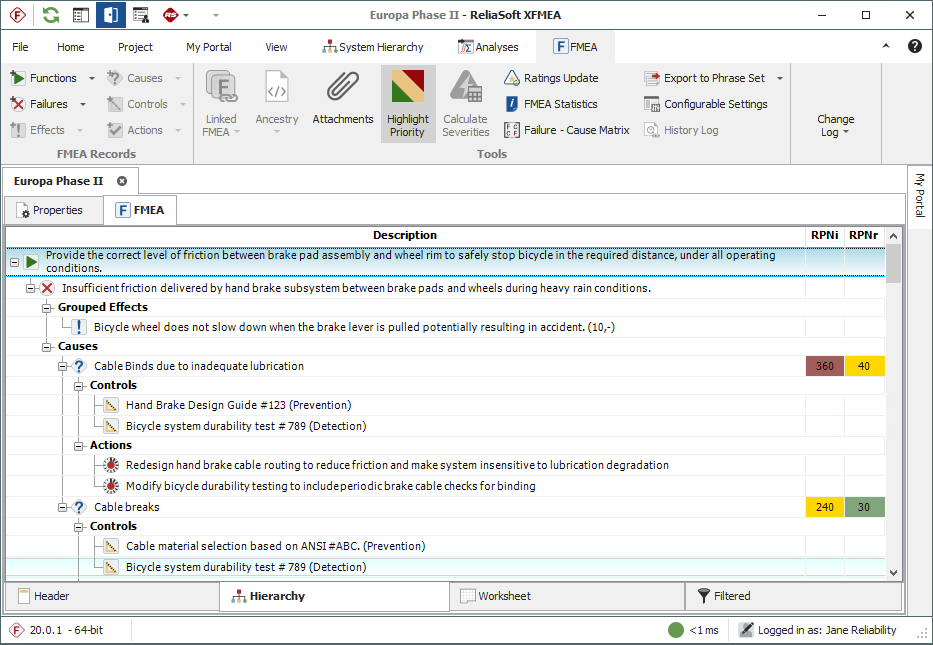
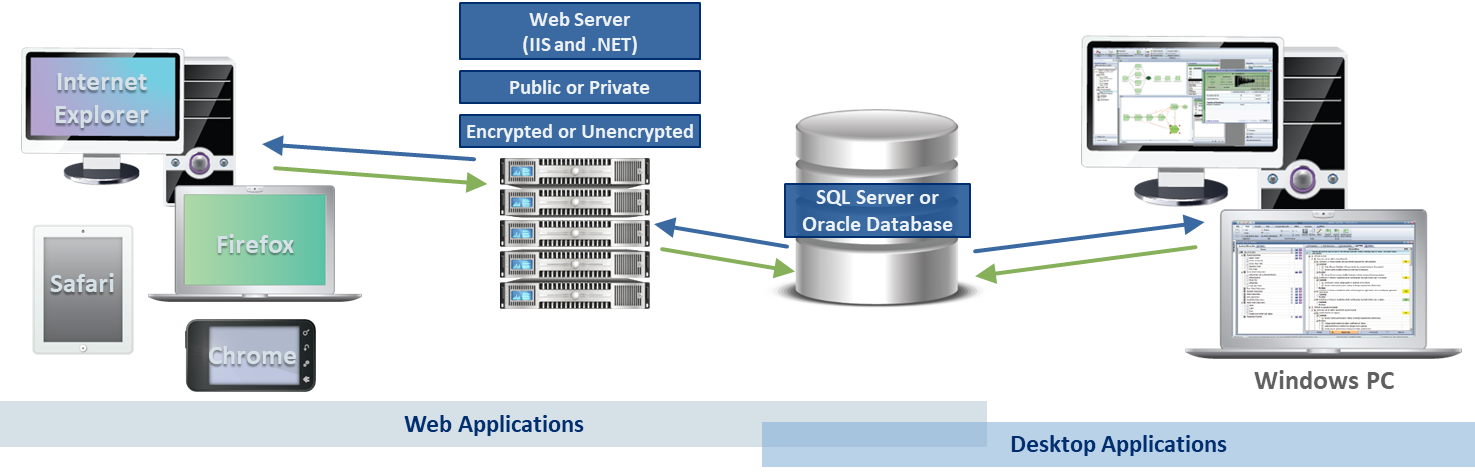
When you are using a PC or laptop, SEP makes it easy to open the full analysis in the relevant ReliaSoft desktop application. If the website is configured for “Remote ReliaSoft,” users can launch the applications on a remote server without having to install and update software on each client computer.

“Remote ReliaSoft” requires at least one Windows server with Microsoft Remote Desktop Services (RDS) and RDS license seats purchased from your preferred Microsoft vendor. Locally hosted licensing is recommended for ReliaSoft applications (Token-based or Floating).

Assigned actions and project plans


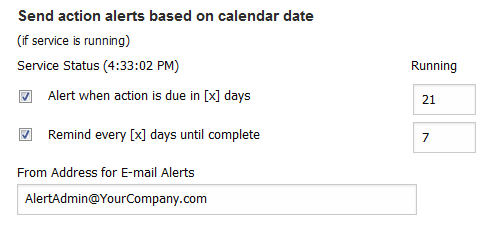
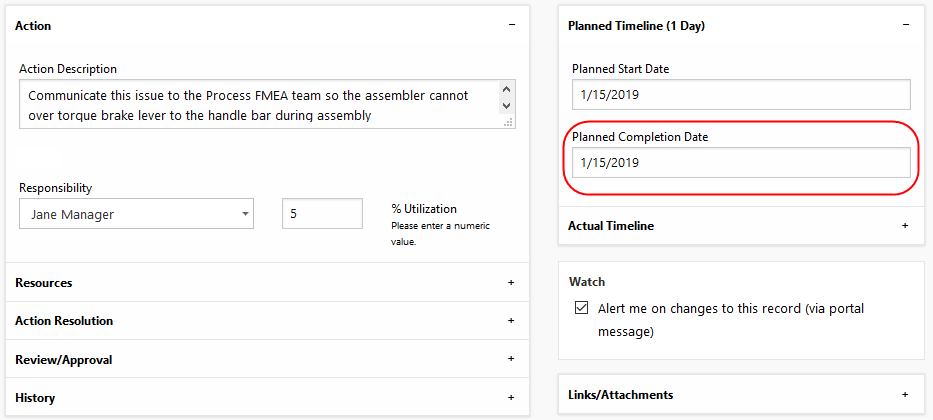
SEP enables your team to track and report progress for assigned actions and provides a streamlined mobile view for project plans. If the service is running on the SEP web server, you can choose to trigger action alerts based on the planned completion date.

Web access for desktop reports


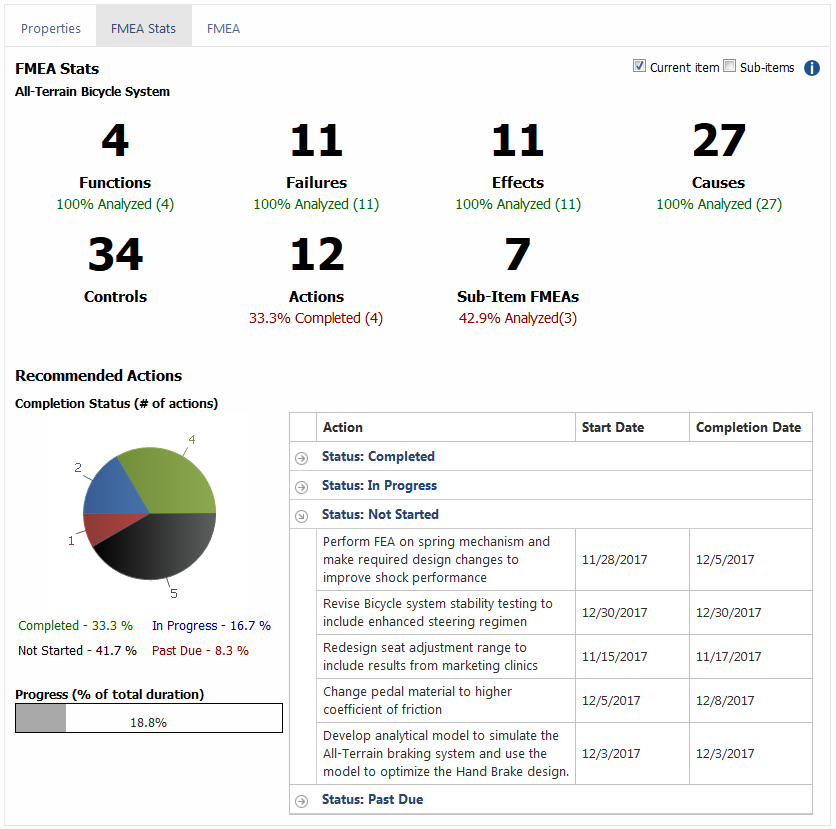
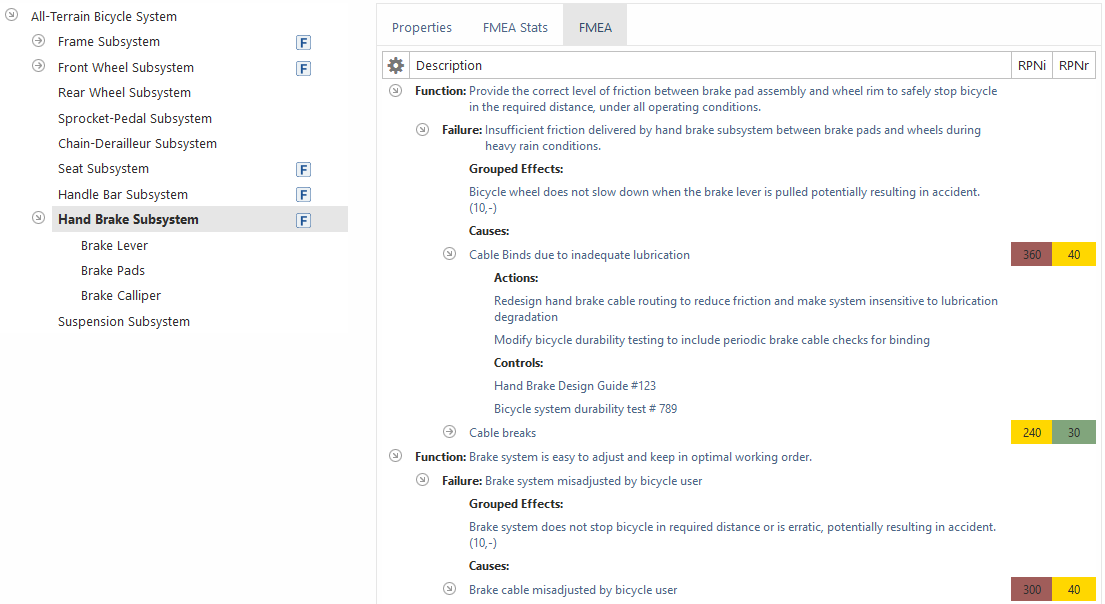
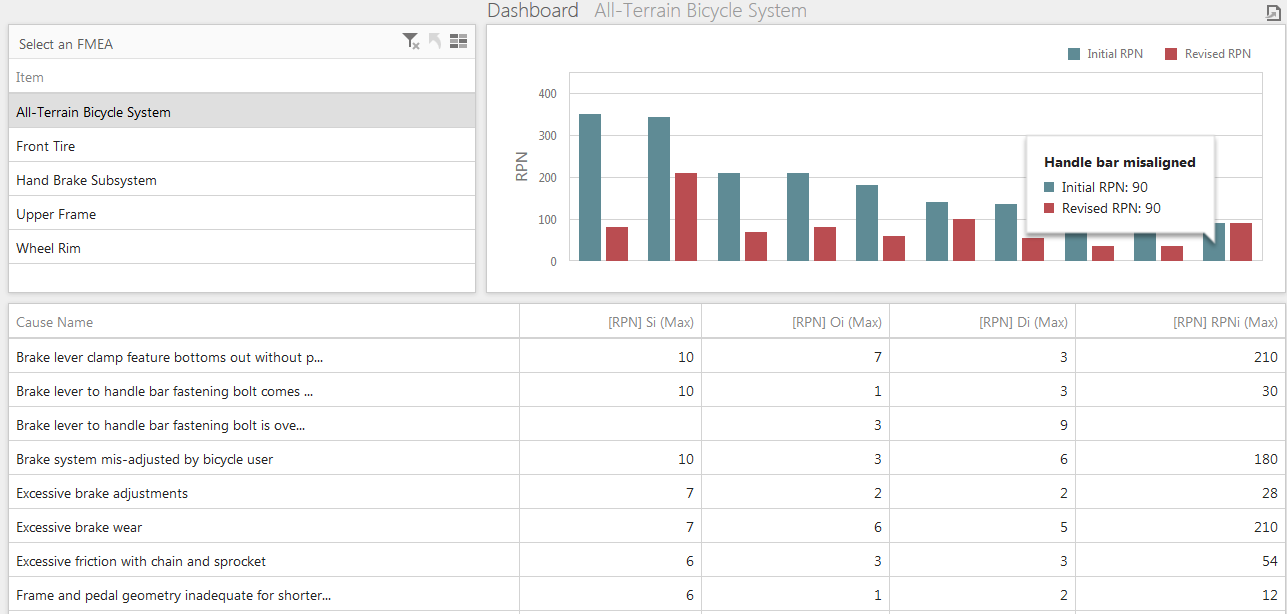
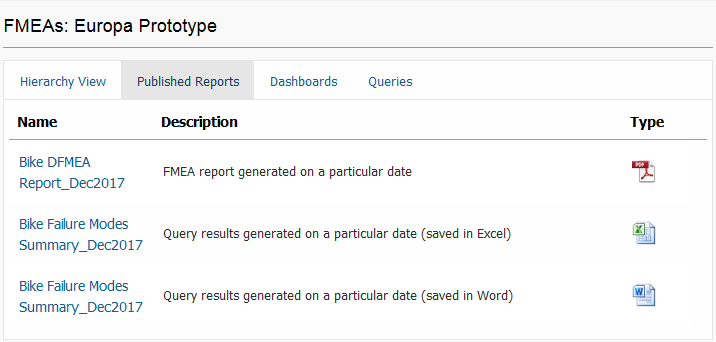
SEP can display a wide variety of graphical dashboards and customized reports based on analysis data from desktop applications. The "Watch" feature makes it easy to manage the specific reports you want to be able to access quickly.
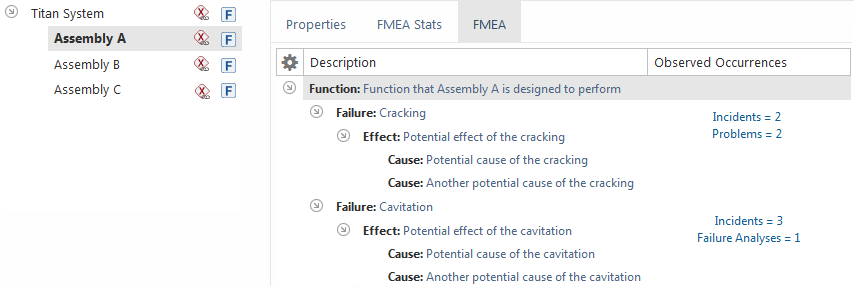
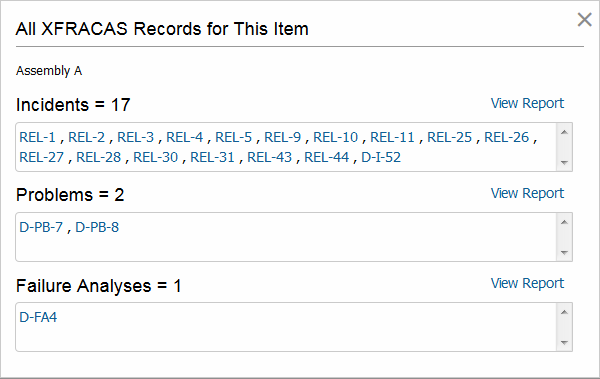
Scalable and distributable web-based architecture


Whether you have 15 users or 15,000 users, SEP is scalable and easy to distribute with nothing extra to install for each user. Your team can access the portal with their preferred web browsers (such as Internet Explorer, Chrome, Firefox or Safari) from a variety of devices (laptop, tablet, etc.).

If you plan to host the database and website on the same server, you will need:

  • Windows 2008 R2 or newer
  • .NET 4.6
  • IIS with support for serving ASP.NET
  • SQL Server (2008 or newer) or Oracle (10g or newer)

Ready to take your reliability program further?