arrow_back_ios
Main Menu
arrow_back_ios
In the Modeling Failure Modes (RBDs) example, we used a reliability block diagram (RBD) approach to analyze a component and its associated failure modes. In this example, we will use the same component and conditions described in the Modeling Failure Modes (RBDs) example, but use a fault tree diagram instead of an RBD to perform the analysis.
The component can fail due to six independent primary failure modes: A, B, C, D, E and F. The component fails if mode A, B or C occurs. If mode D, E or F occurs alone, the component does not fail; however, the component will fail if any two (or more) of these modes occur (i.e., D and E; D and F; E and F). Furthermore, modes A, B and C can be broken down further into the events (sub-modes) that can cause them. Once a mode occurs, its sub-mode also occurs and does not go away.
The following RBD illustrates the relationship between the primary modes.
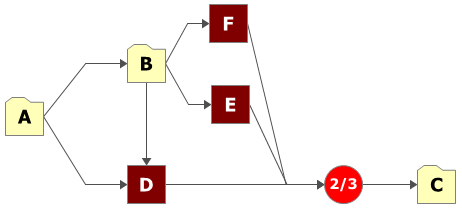
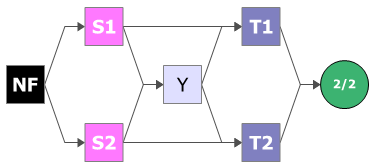
There are five independent (i.e., if one mode occurs, the rest are not more likely to occur) sub-modes associated with mode A: events S1, S2, T1, T2 and Y. There are three possible ways for mode A to manifest itself:
The following RBD illustrates the conditions for mode A.
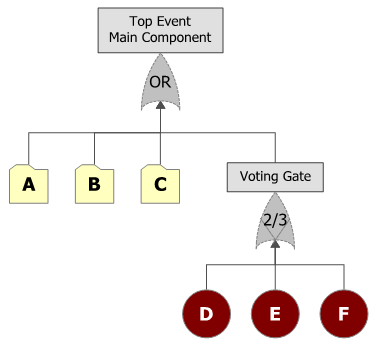
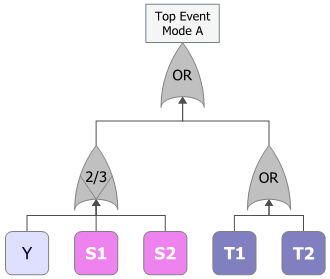
The following diagram shows the corresponding fault tree for mode A. The vote number in the voting gate is set to 2, indicating that at least 2 of the 3 conditional events must occur for mode A to occur.
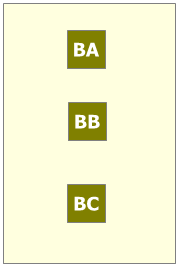
There are three dependent sub-modes associated with mode B: events BA, BB and BC. Two out of the three events must occur for mode B to occur. Specifically, when one event occurs, the MTTF of the remaining events is cut in half. This describes a load sharing configuration. The reliability function for each block will change depending on the other events. Therefore, the reliability of each block is not only dependent on time, but also on the stress (load) that the block sees.
The following picture shows the RBD of mode B. The blocks representing the sub-modes are inside a load sharing container. The number of required paths in the load sharing container is set to 2, indicating that 2 out of the 3 contained events must occur for mode B to occur.
The following diagram shows the corresponding fault tree of mode B. The load sharing gate (LS) in the fault tree replaces the load sharing container in the RBD. The vote number in the load sharing gate is set to 2, indicating that at least 2 of the events must occur for mode B to occur.
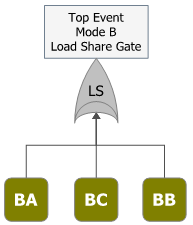
The weight proportionality factor of each event is set to 1, indicating that they will share the load evenly (33.33% of the load each) when all are operating. If one fails, the other two will take over the load.
Note that a load sharing gate is not a standard fault tree gate. BlockSim introduces this gate to allow for representation of dependent events in a fault tree diagram. It behaves in exactly the same way as a load sharing container in an RBD.
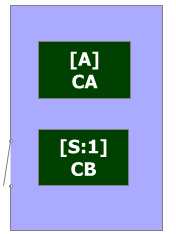
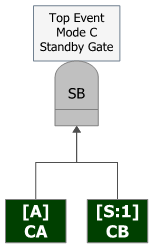
There are two sequential sub-modes associated with mode C: events CA and CB. Both events must occur for mode C to occur. Event CB will occur only if event CA has occurred. If event CA has not occurred, then event CB will not occur.
This scenario is similar to standby redundancy. Basically, if CA occurs then CB gets initiated. The following picture shows the RBD of mode C. The blocks representing the sub-modes are inside a standby container. The operation of block CA is set to Active, while the operation of block CB is set to Standby.
The following diagram shows the corresponding fault tree of mode C. The standby gate (SB) in the fault tree replaces the standby container in the RBD.
If you use the same universal reliability definitions (URDs) that were defined in Example 2, the results of the fault tree diagram analysis will be the same as the results obtained by the RBD approach.
BlockSim has many options for modeling a system. The following figure illustrates an alternative fault tree diagram for the component.