arrow_back_ios

Main Menu

See All 분석 및 시뮬레이션 소프트웨어 See All DAQ 소프트웨어 See All 드라이버 및 API See All 유틸리티 See All 진동 제어 See All 고정밀 및 보정 시스템 See All DAQ 시스템 See All S&V 핸드헬드 장치 See All 산업용 전자 제품 See All 전력 분석기 See All S&V 시그널 컨디셔너 See All 음향 트랜스듀서 See All 전류 및 전압 센서 See All 변위 센서 See All 힘 센서 See All 로드셀 See All 멀티 컴포넌트 센서 See All 압력 센서 See All 스트레인 센서 See All 스트레인 게이지 See All 온도 센서 See All 기울기 센서 See All 토크 센서 See All 진동 트랜스듀서 See All 진동 테스트 장비용 액세서리 See All 진동 컨트롤러 See All 측정 여기기 See All 모달 익사이터 See All 파워 앰프 See All LDS 셰이커 시스템 See All 테스트 솔루션 See All 액추에이터 See All 내연 엔진 See All 내구성 See All eDrive See All 생산 테스트 센서 See All 변속기 및 기어박스 See All 터보 충전기

이벤트 분석 모듈

Flowchart models


Use a familiar and intuitive flowcharting concept to build graphical models for the scenarios that you are trying to understand, quantify and/or simulate. Employ easy point-and-click techniques to create flowcharts from blocks, gates and other resources that are already defined in the project — and easily define new modeling elements as your flowchart evolves.

Flexible array of building blocks


An extensive and flexible selection of building blocks to serve different functions within the flowchart model. Some of the most used modeling features include the ability to:

  • Use variables to store numerical values.
  • Build simple or complex equations for a wide variety of purposes.
  • Check incoming values against one or more conditions in order to trigger various responses. This includes "if statements" with true/false outcomes for single or multiple inputs (conditional blocks and logic gates), as well as "switch statements" with multiple possible outcomes (branch gates).
  • Use tables to store an array of values in rows and columns.
  • Use summing gates to perform mathematical operations on multiple incoming values to determine a single output value.
  • Control the flowchart path, including loops and other complex configurations, using flag markers and go-to-flag blocks, stop flags, counter blocks and reset blocks.
  • Use result storage blocks to compute averages, sums, arrays, minimums/maximums and more.
  • Use binary nodes to determine outcome probabilities.
  • Describe any probability that can be constant or described by a statistical distribution.
  • Use a simulation definition so that you can use one or more results from the simulation in the flowchart.

BlockSim results within Event Analysis flowcharts


Event Analysis flowcharts and BlockSim diagrams are directly integrated so you can work with both types of analyses together, and share many of the same resources. You have an option to use outputs from BlockSim RBDs or fault trees as inputs in your flowcharts. For example, if you have an analytical diagram that describes the reliability of a system, you can publish a model that will provide the system reliability when it is needed in any Event Analysis flowchart. Likewise, if you have a simulation diagram that estimates a system's operating cost, uptime, availability and other factors of interest, you can use the new simulation definition resource to draw any of these results into a flowchart.

Simulation Worksheets


You can investigate the effect of one or more settings on the simulation results, such as:

  • Design an experiment in Weibull++—> simulate the experiment in Event Analysis module (BlockSim)—> then return to Weibull++ and analyze the simulated "response" data.
  • Perform batch simulation of an RBD, using different input values for each simulation. For example, this tool makes it easy to run a set of simulations that compare a variety of possible scenarios by altering specific inputs for each simulation.

Diagram skins


Diagram skins allow you to maximize the visual impact and appeal of your flowcharts by applying a set of preferences for the colors, lines, text and images used. Choose from a variety of skins or create your own. Diagram skins are universal across all desktop applications. This means that a single skin can contain the appearance settings for all types of diagrams in BlockSim, Weibull++ and XFMEA/RCM++.

Intelligent features


Convenient color-coding


As you type, the module automatically color-codes recognized resources and functions to make it easy to spot potential problems.


Resource Preview


When editing an equation, it provides a quick summary of the properties of each resource or function. If you need more information or want to change a resource, you can open the full resource properties window with a click of a button.


Automatic conversion for time values entered in different units


You can define conversion factors for entering time values in different units.


Function selector and equation editor


Instant access to all of the building blocks that you will use in the equations for your analyses, which includes:

  • Any of the user-defined resources available in the project
  • Built-in internal functions to insert specific flowchart- or simulation-related information into an equation. The versatile getvalue functions can pull values from variables, tables or analysis workbooks and you can also use functions that obtain specific metrics from a given probability distribution.
  • Any of the predefined functions including:
    • Engineering functions such as Bessel, Error functions, etc.
    • Math and Trigonometry functions such as Sine, Derivative, Integral, Logarithm, etc.
    • Financial functions such as Future Value, Cumulative Interest Paid, Periodic Payment for an Annuity, etc.
    • Statistical functions such as the Weibull distribution, the Fisher Transformation, the Chi-Squared distribution, etc.
    • Logical functions such as IF statements and TRUE/FALSE statements.

Debugger utility


This integrated utility can help you validate and "debug" your flowchart models, and it allows you to move through each step in a flowchart and watch the values as each block or resource is executed. You can also watch the progress during automatically performed number of simulations in "debug" mode.

Extensive potential applications


With Event Analysis module, you can create any flowchart model. Some of the most common include:

  • Systems/product engineering and modeling
    • Reliability and failure analysis
    • Risk and hazard analysis
    • Vulnerability Analysis
    • Conceptual design
    • Probabilistic design
    • Systems engineering
    • Manufacturing
    • Materials handling
    • Quality control / quality assurance
  • Environmental systems modeling
  • Hazardous waste sites, safety analysis
  • Natural resource planning and management
  • Business, financial and economic modeling
    • Strategic planning
    • Business process modeling
    • Financial analysis
    • Risk analysis and management
    • Cost modeling
    • Portfolio management
    • Six Sigma
    • Yield analysis
    • Supply chain modeling
    • Financial engineering
  • Ecosystem modeling

Customizable results and plots


Once you have constructed a flowchart model that will explore the scenario of interest to you, the Event Analysis executes the model to generate desired results. This may include averages, sums, arrays, minimum values, maximum values, etc. For models without randomized values, a single execution will yield all results of interest. When randomized values are present, discrete event Monte Carlo simulation will be utilized.


  • During simulation you can track the real-time values for a result of interest while the model is executed. Watch the result's progress over time or see how your results vary during sensitivity analysis.
  • After simulation you can see final results directly in the flowchart. View the values for all result storage blocks, as well as the last values for other blocks, if desired. Plus, you can use Excel®-compatible spreadsheets to explore all applicable results, and to copy/paste or export results of interest to your reports or customized analyses.
  • The Plot Setup allows you to completely customize the "look and feel" of plot graphics while the RS Draw metafile graphics editor provides the option to insert text, draw objects or mark particular points on plot graphics. You can save your plots in a variety of graphic file formats for use in other documents. You can also use interactive plot zoom.

Sensitivity analysis


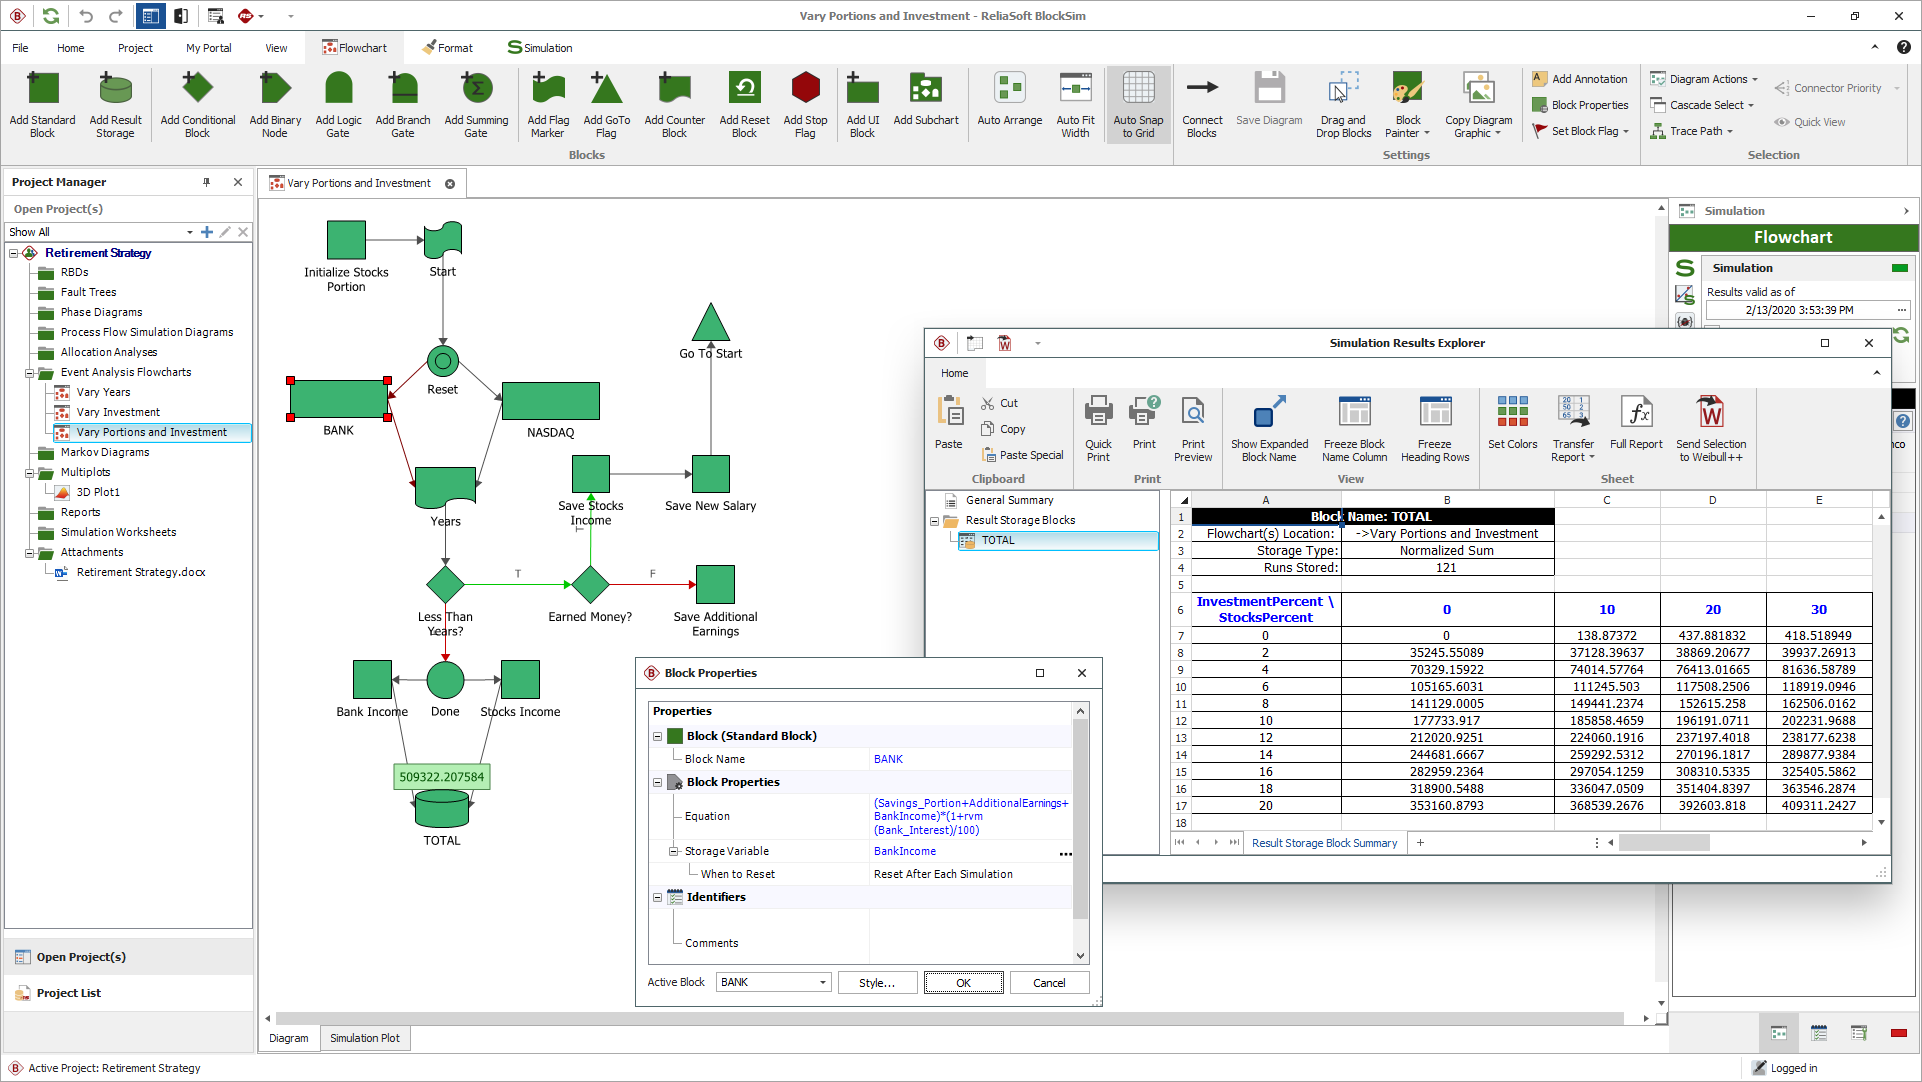
This feature makes it easy to vary one or two variables across analyses/simulation runs. If you are analyzing potential investment strategies, you may wish to vary the number of years that you will be investing and/or the percentage of your income that will be invested to see how different inputs will affect the final results. Likewise, you may wish to generate reliability or availability results for a range of times in order to examine the equipment’s behavior over time.

Multiple analyses for optimum values


The Multiple Analyses feature takes the sensitivity analysis capability a step further by allowing you to automatically vary the specified variable(s) in order to determine the value that minimizes or maximizes a specified result. For example, you could use this feature to automatically determine the optimum amount of inventory to maximize profits or the optimum preventive maintenance (PM) interval to minimize costs. The results of each analysis can be displayed in the plot sheet, with the optimum value marked on the plot.

Ready to take your reliability program further?