arrow_back_ios

Main Menu

See All 분석 및 시뮬레이션 소프트웨어 See All DAQ 소프트웨어 See All 드라이버 및 API See All 유틸리티 See All 진동 제어 See All 고정밀 및 보정 시스템 See All DAQ 시스템 See All S&V 핸드헬드 장치 See All 산업용 전자 제품 See All 전력 분석기 See All S&V 시그널 컨디셔너 See All 음향 트랜스듀서 See All 전류 및 전압 센서 See All 변위 센서 See All 힘 센서 See All 로드셀 See All 멀티 컴포넌트 센서 See All 압력 센서 See All 스트레인 센서 See All 스트레인 게이지 See All 온도 센서 See All 기울기 센서 See All 토크 센서 See All 진동 트랜스듀서 See All 진동 테스트 장비용 액세서리 See All 진동 컨트롤러 See All 측정 여기기 See All 모달 익사이터 See All 파워 앰프 See All LDS 셰이커 시스템 See All 테스트 솔루션 See All 액추에이터 See All 내연 엔진 See All 내구성 See All eDrive See All 생산 테스트 센서 See All 변속기 및 기어박스 See All 터보 충전기

생활 데이터 분석의 업계 표준

Life data types, distributions and parameter estimation


Weibull++ supports all types of life data analysis, including:

  • Complete (failure time)
  • Right censored (suspension time)
  • Left censored
  • Interval censored
  • Free-form

Parameter estimation options for standard life data analysis include: 

  • Rank Regression on X (RRX)
  • Rank Regression on Y (RRY)
  • Maximum Likelihood Estimation (MLE)
  • Non-Linear Rank Regression
  • Fractional Failure Analysis

All major lifetime distributions (including all forms of the Weibull distribution) are also supported:

  • Weibull
  • Normal and Lognormal
  • Exponential
  • Gamma and Generalized Gamma
  • Logistic and Loglogistic
  • Gumbel
  • Bayesian-Weibull
  • Mixed Weibull
  • Competing Failure Modes (CFM)

Distribution wizard and ranking methods


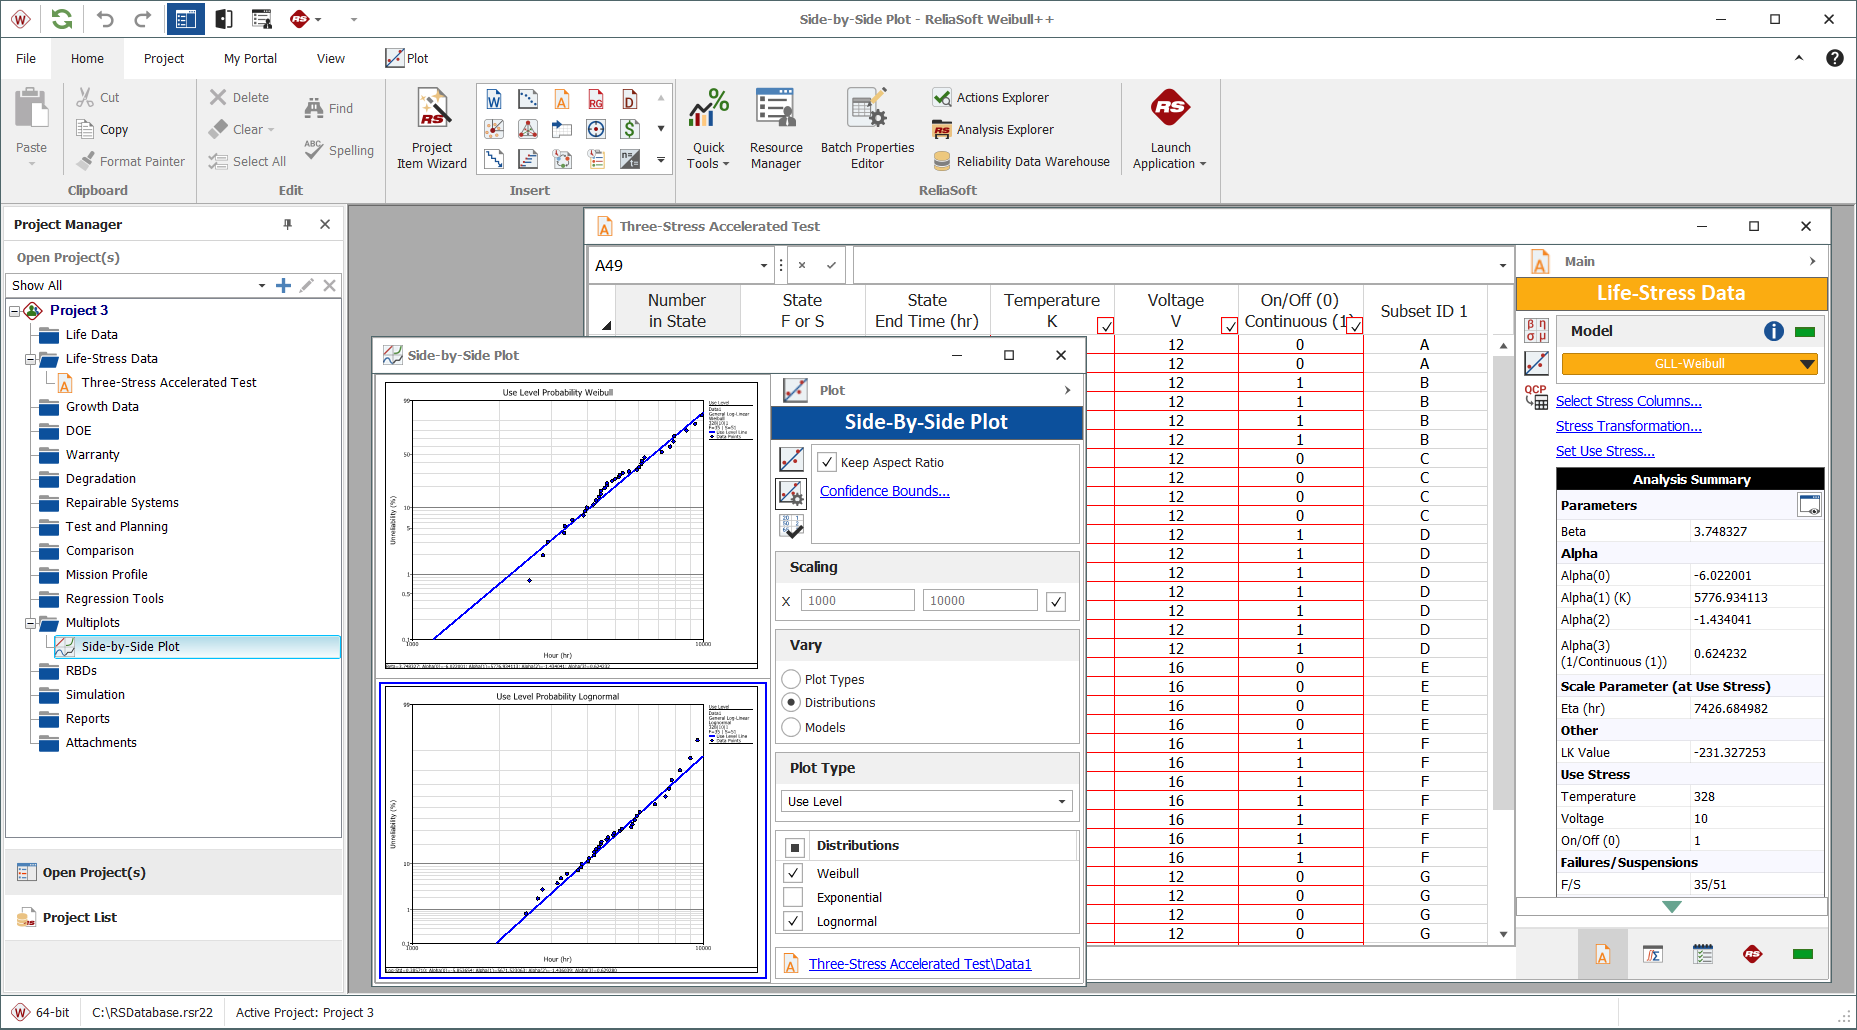
If you are not sure, which model is appropriate for a given data set, the Distribution Wizard automatically performs several types of goodness-of-fit tests (Kolmogorov-Smirnov, Correlation Coefficient, Likelihood value) in order to rank the available distributions. It comes also with the ability to rank data points using Kaplan-Meier or Median Ranks.

Confidence bounds


Weibull++ provides confidence bounds for parameters, calculated results and plots. Depending on the specific analysis method used, the confidence bounds may be calculated using the Fisher Matrix, Likelihood Ratio, Beta Binomial or Bayesian (BSN) approach.

Reliability test design


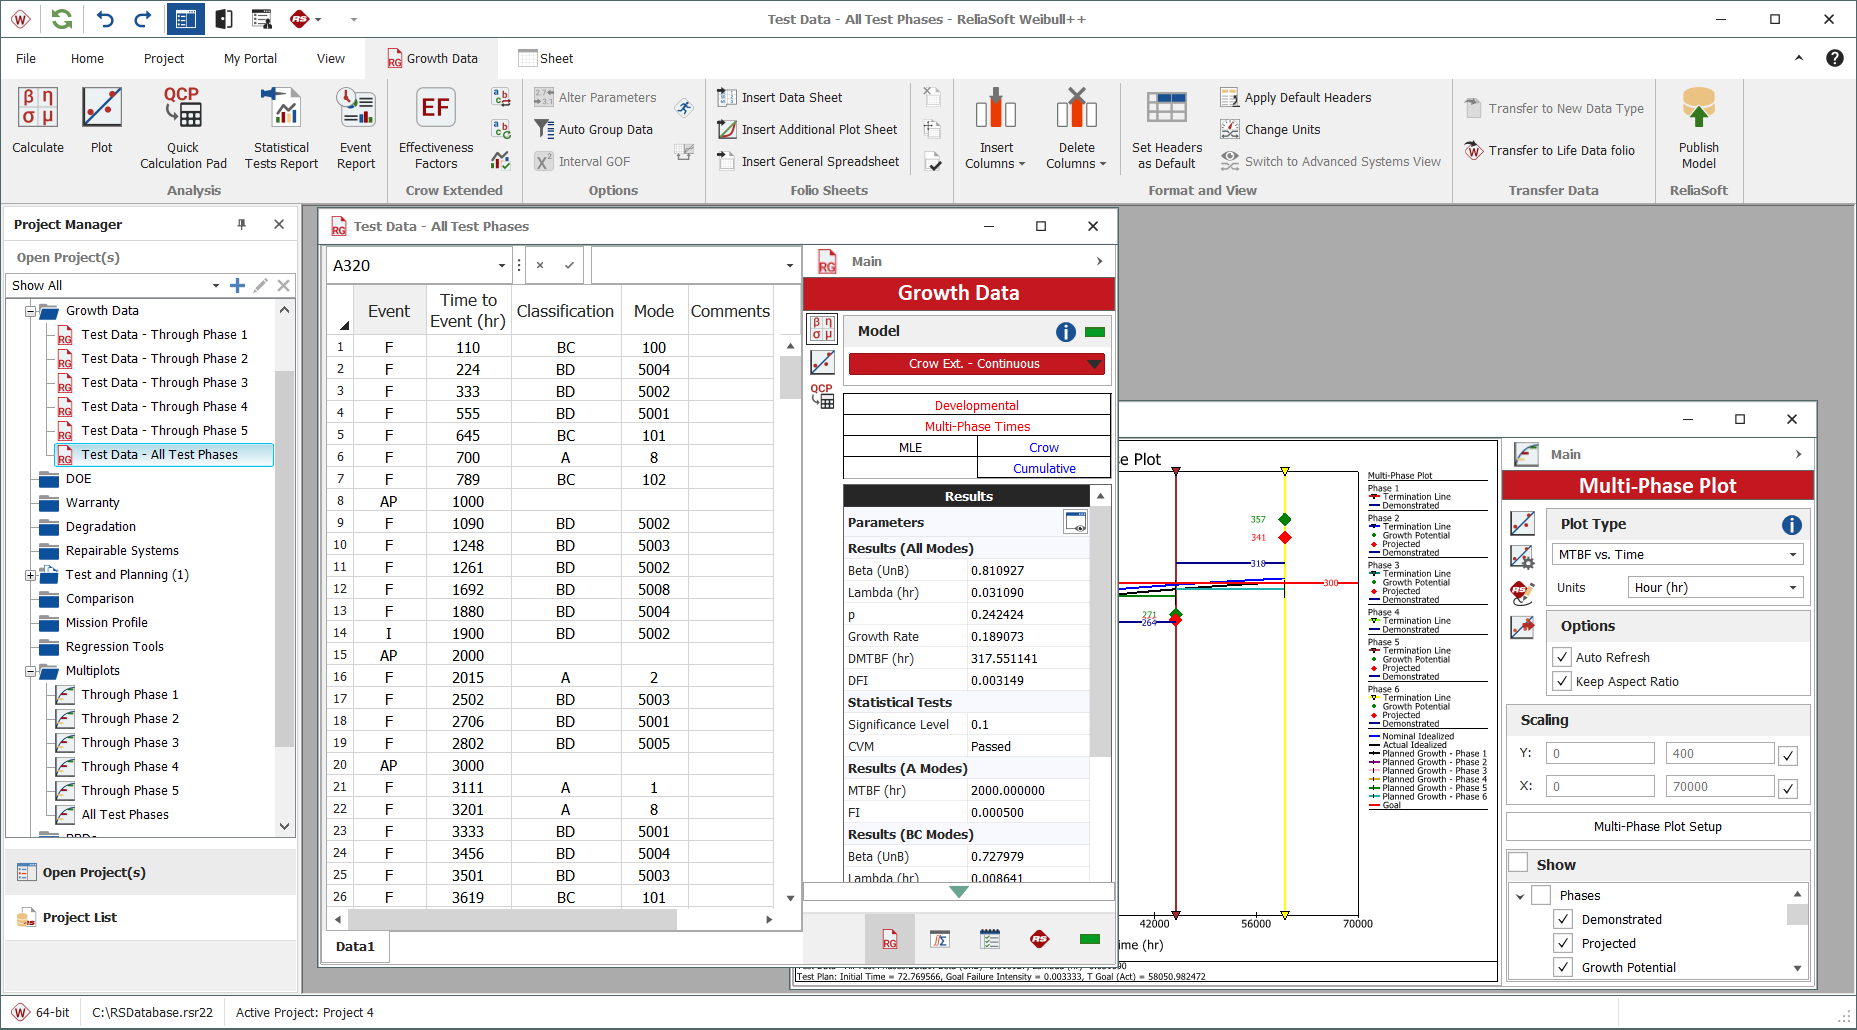
Reliability demonstration test design determines the appropriate sample size, test duration or other variables for designing effective reliability tests and demonstration tests. Expected failure times plot displays times-to-failure that you may expect to observe for a given reliability life test.


Difference detection matrix allows you to detect the difference between the reliabilities of two separate designs.

Warranty data analysis


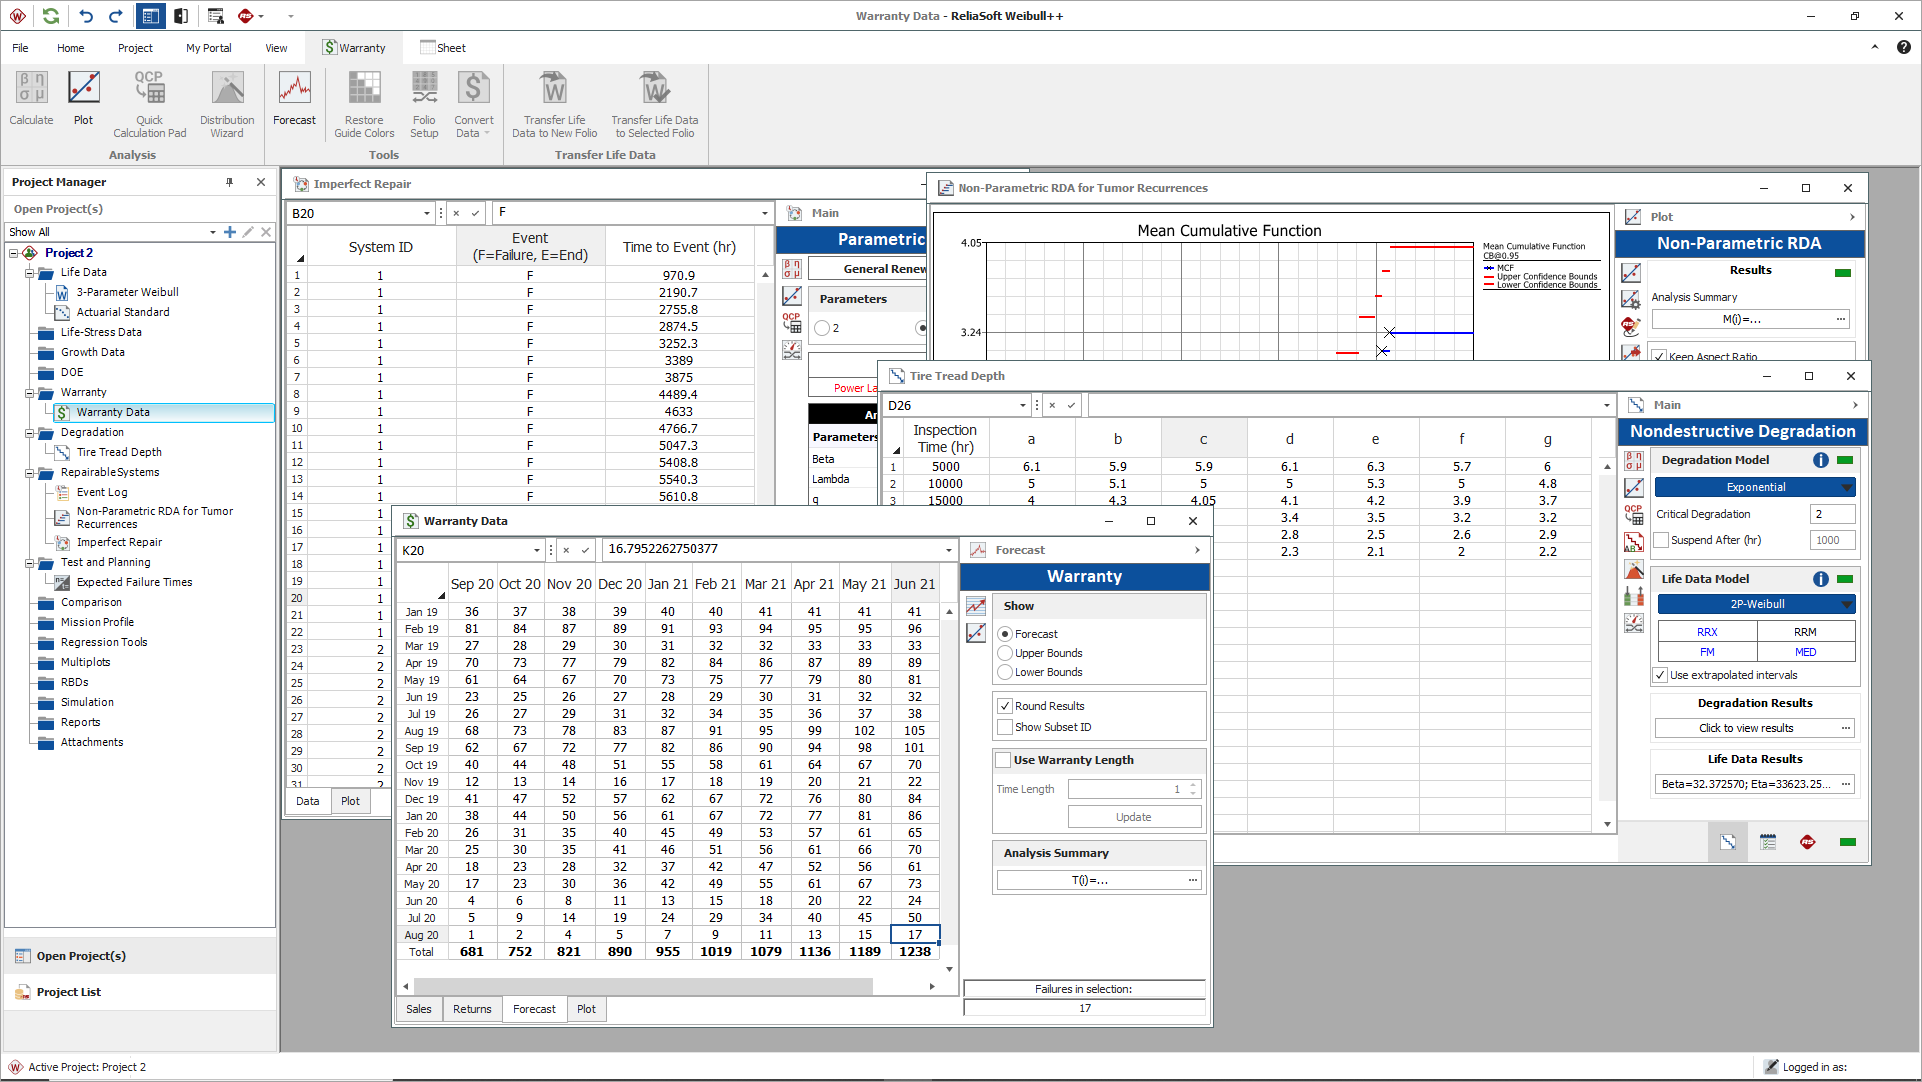
A choice of data entry formats available for using sales/returns data to perform life data analysis and make warranty projections: nevada chart, times-to-failure, dates of failure and usage (e.g., mileage, cycles, etc.), as well as the time.

Degradation data analysis


Use the linear, exponential, power, logarithmic, Gompertz or Lloyd-Lipow models to extrapolate the failure times of a product based on its performance (degradation) over a period of time. Weibull++ also includes destructive degradation analysis and the option to create user-defined degradation models.

Reliability block diagrams


The built-in diagram feature allows you to create reliability block diagrams (RBDs) using blocks that are linked to analyzed Weibull++ folios. This feature can be used to analyze complex competing failure modes or simple system reliability. You can even send RBDs built in Weibull++ to BlockSim. This process exports the blocks into a new BlockSim simulation diagram, allowing you to perform further analyses such as system maintainability, availability and related analyses.

Design of experiments (DOE)


Weibull++ supports a variety of experiment design types, including factorial and fractional designs, Taguchi robust designs, response surface method designs, and DOE based on product life, called reliability DOE.

Life data results, plots, and reports


The Quick Calculation Pad (QCP) is a "Calculation Log" that allows you to record the results from a series of different calculations and then copy/paste the information as needed.

The software also provides a complete array of calculated results and plots based on the analysis. For life data analysis, this includes:

  • Reliability or probability of failure
  • Conditional reliability or conditional probability of failure
  • Reliable life (i.e., time for a given reliability, also called "warranty time")
  • Probability plots and pdf plots
  • Contour plots
  • Failure/suspension histograms, pie charts or timelines
  • BX% life (i.e., time for a given unreliability)
  • Mean life
  • Failure rate


Weibull++ provides a complete array of advanced plotting tools. The Plot Setup allows you to completely customize the "look and feel" of plot graphics. You can save your plots in a variety of graphic file formats for use in other documents.

  • Overlay Plots (aka Multi-Plots)
  • Side-by-Side Plots
  • RS Draw® Metafile Graphics Editor
  • 3D Plots


Customizable reports are also built into Weibull++. They seamlessly integrate spreadsheet and word processing capabilities while enabling you to include calculated results and plots from your analysis.

Accelerated Life Testing module


When you purchase the Accelerated Life Testing module, you get new features in Weibull++ designed for accelerated test planning and quantitative accelerated life testing data analysis. The module supports a complete array of utilities for designing accelerated life tests, evaluating the fit of the model, calculating reliability metrics, generating plots and performing related statistical analyses. Additionally, it provides the life-stress relationships required to analyze accelerated life test data with up to 8 simultaneous stress types, where stress is constant or varies with time.

Reliability Growth module


When you purchase the Reliability Growth module, you get new features in Weibull++. Using reliability growth models, you can analyze data from both developmental testing and fielded repairable systems. During the development phase, you are able to quantify and track the system’s reliability growth across multiple test phases. The module supports advanced methods for reliability growth projections, planning and management. 

Ready to take your reliability program further?