Reliability Phase Diagrams, or RPDs, can be thought of as an extension of the Reliability Block Diagram (RBD) approach. RPDs graphically describe the sequence of different operational and/or maintenance phases experienced by a system. This means that, unlike an RBD which is limited to systems with fixed configurations, RPDs can be used to represent complex systems that may change over time. The change may be in the reliability configurations (i.e. the RBD) and/or other properties, such as the availability of resources or throughput properties. In this article, we will use ReliaSoft BlockSim to illustrate the use of reliability phase diagrams to study a complex system.
In complex systems, each stage during a mission can be represented by a phase block. The properties of the phase block are inherited from an RBD corresponding to the system's reliability configuration in that phase, along with any associated resources of the system during that time. A reliability phase diagram is then a series of such phase blocks connected in chronological order.
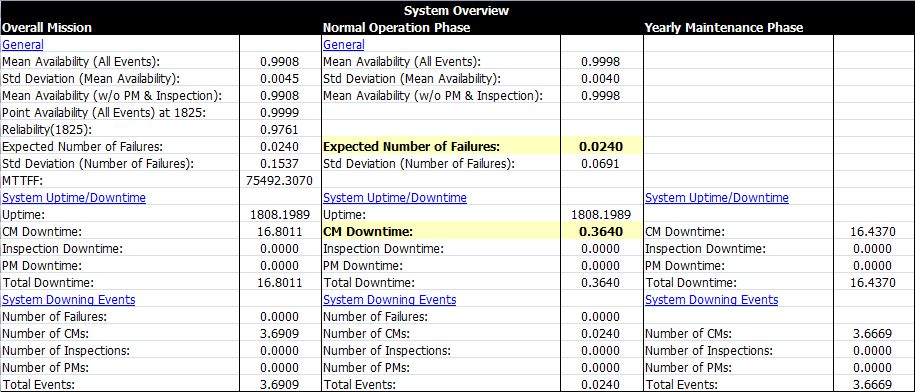
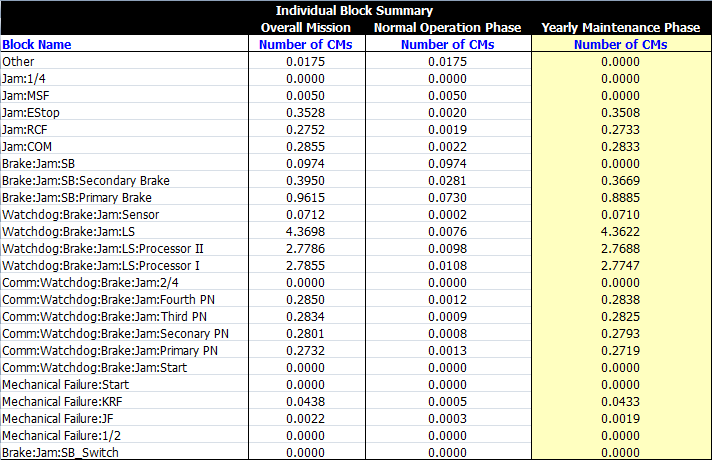
Consider a process where a robot manipulator is used. Because the system operates in a remote location and stopping the operation is costly, individual components that fail but do not cause a system failure are not repaired immediately. The failed components are repaired only during the scheduled yearly maintenance of the entire operation. System failures, however, are given immediate attention, and these repairs are costly, time-consuming and incur additional warranty costs per hour of downtime. The robot manipulator is warranted for 5 years. The goal of the analysis is to determine the warranty costs incurred by the system. In order to accomplish this, three metrics are of interest: the expected number of failures of the system, the system downtime associated with unplanned system failures and the expected number of component replacements during the yearly maintenance.
Representing the robot system with a single RBD would result in limitations. For example, a corrective repair of a component that is due to a system failure needs to be handled differently than a corrective repair performed during the yearly maintenance because they incur different costs. Therefore, the following RPD will be used.
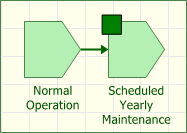
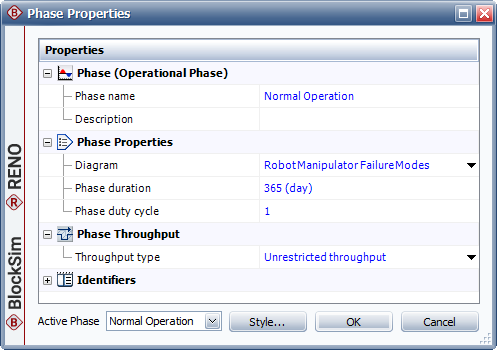
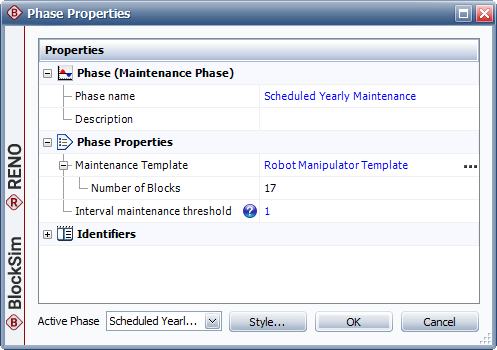
By using two phases to represent the system, we segregate the results obtained from different stages (normal vs. yearly maintenance) as well as any input variations. The normal operation phase represents the system while in operation. In this phase, blocks that fail but do not bring down the system are not repaired upon failure but remain down until the scheduled yearly maintenance. However, the failure of a block that causes a system failure will result in the repair of that block as well as a repair of all other failed components. The Normal Operation phase inherits its properties from an RBD representing the system (Figure 2). Meanwhile, the Scheduled Yearly Maintenance phase represents the portion of the mission time when the system is brought down each year so that maintenance actions can be performed on some or all of its components. In BlockSim, a maintenance phase block is defined by, and linked to, a maintenance template. This template is a list of the specific components (blocks) that are designated to undergo inspection, repair or replacement actions during the maintenance phase (Figure 3).
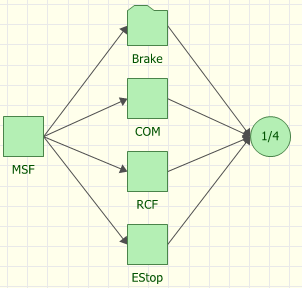
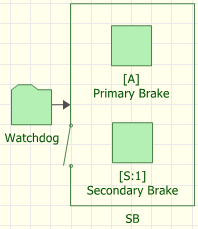
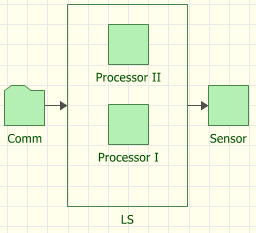
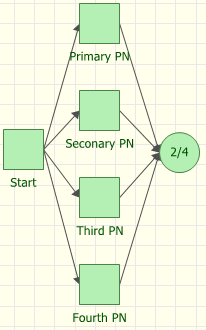
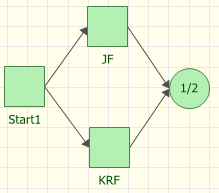
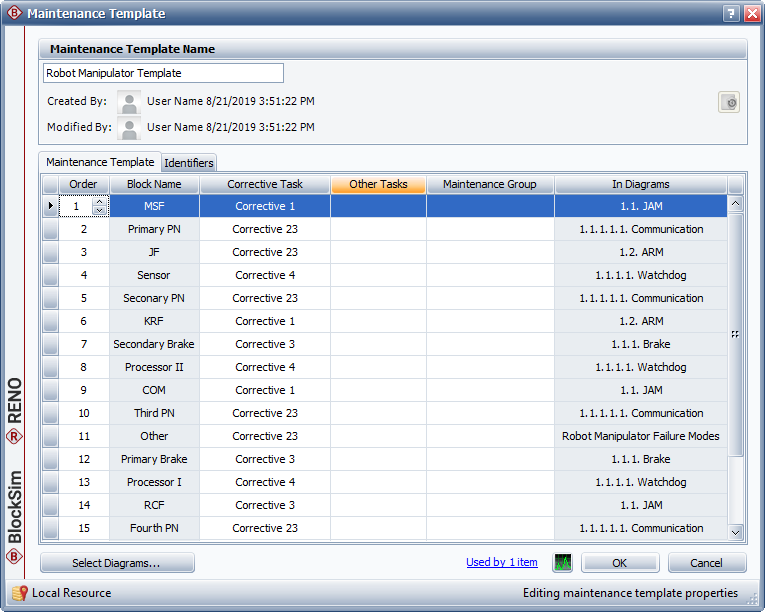
Table 1 gives the failure and repair inputs of the system.
| Block name | Failure distribution normal operation (in days) |
Repair distribution normal operation (in days) |
Repair distribution yearly maintenance (in days) |
|---|---|---|---|
| JF | WBL(Beta=4, Eta=6000) | EXP(Mean=12) | EXP(Mean=3) |
| KRF | WBL(Beta=2, Eta=7000) | EXP(Mean=12) | EXP(Mean=4) |
| COM | EXP(Mean=5000) | EXP(Mean=16) | EXP(Mean=4) |
| EStop | EXP(Mean=4000) | EXP(Mean=14) | EXP(Mean=2) |
| MSF | WBL(Beta=3, Eta=10000) | EXP(Mean=13) | EXP(Mean=4) |
| RCF | EXP(Mean=5000) | EXP(Mean=14) | EXP(Mean=5) |
| Primary brake | Cold standby, active distribution: WBL(Beta=2, Eta=1000) |
EXP(Mean=10) | EXP(Mean=5) |
| Secondary brake | Cold standby, active distribution: WBL(Beta=2, Eta=1000) |
EXP(Mean=10) | EXP(Mean=5) |
| Processor I | Load sharing, WBL-IPL: Beta=1.5, K=2.38E-4, n=1.32) |
EXP(Mean=9) | EXP(Mean=2) |
| Processor II | Load sharing, WBL-IPL: (Beta=1.5, K=2.38E-4, n=1.32) |
EXP(Mean=9) | EXP(Mean=2) |
| Sensor | EXP(Mean=5000) | EXP(Mean=9) | EXP(Mean=2) |
| Primary PN | EXP(Mean=5000) | EXP(Mean=12) | EXP(Mean=3) |
| Secondary PN | EXP(Mean=5000) | EXP(Mean=12) | EXP(Mean=3) |
| Third PN | EXP(Mean=5000) | EXP(Mean=12) | EXP(Mean=3) |
| Fourth PN | EXP(Mean=5000) | EXP(Mean=12) | EXP(Mean=3) |
| Other | EXP(Mean=100000) | EXP(Mean=15) | EXP(Mean=3) |
From the results we can conclude that the majority of the time (89.4%) our system should be running at 100% capacity and that after the 10-year period there is about a 5.3% chance that the system will degrade to a point from which it cannot be restored (the salvage state).