${/keySellingArguments/1/value}
Easy drag-and-drop techniques allow you to build reliability block diagrams (RBDs) for the simplest to the most complex systems.
Markov diagrams allow you to model the behavior of a system in various states using a memoryless process, where the next state of the system is only dependent on the transition values and the current state of the system. This gives you the ability to look at partial or degraded working states, and to start analysis in varying states. If you have the Event Analysis module you can also analyze a Markov diagram during a simulation and use the analysis result in your flowchart.
Use the convenient Quick Calculation Pad (QCP) and plot sheets to calculate and visualize key system reliability metrics such as:
For each analytical diagram, BlockSim identifies the unique combinations of component failure that can cause system failure. These minimal cut sets can be used to understand the structural vulnerability of a system.
FRED Reports (Failure Reporting, Evaluation and Display) provide an intuitive graphical presentation of key metrics, with color-coding to identify the ones that may be critical for system improvement. FRED reports are available for analytical and simulation diagrams.
BlockSim provides a set of Reliability Importance plots designed to show the relative importance of each component with respect to the overall reliability of a system.
BlockSim provides a tool dedicated to helping you find the most effective reliability allocation to meet a system’s reliability goal. This feature supports Equal, Weighted and Cost Optimized methods. Start at the system level and click your way to the component or failure mode level while the software automatically computes the target reliability for each item/mode and transfers it to the next.
BlockSim simulation capability for reliability, availability, maintainability and supportability analysis of repairable systems is more flexible and realistic than ever. For a new system, you can use simulation results to optimize the design and make projections about how the system may perform in the field. For existing equipment, use the results for maintenance planning, throughput estimates, life cycle cost estimation and more.
When you utilize simulation, the analysis can consider:
BlockSim simulations generate a wide variety of results at the system and/or component level (such as Uptime/Downtime, Mean Time to First Failure (MTTFF), Availability, Reliability, Number of Failures, Number of PMs/Inspections, Costs, etc.). You can use these results for many different applications, including:
The Log of Simulations feature provides the information you need to evaluate the variability in specific simulation results of interest.
Use the linear, exponential, power, logarithmic, Gompertz or Lloyd-Lipow models to extrapolate the failure times of a product based on its performance (degradation) over a period of time. Weibull++ also includes destructive degradation analysis and the option to create user-defined degradation models.
BlockSim allows you to specify both the direct and indirect costs associated with the maintenance strategies that you have defined, including costs related to downtime, maintenance crews, spares, etc. This yields a wide array of simulation results that are instrumental in performing realistic LCC assessments. With BlockSim modeling flexibility, you can:
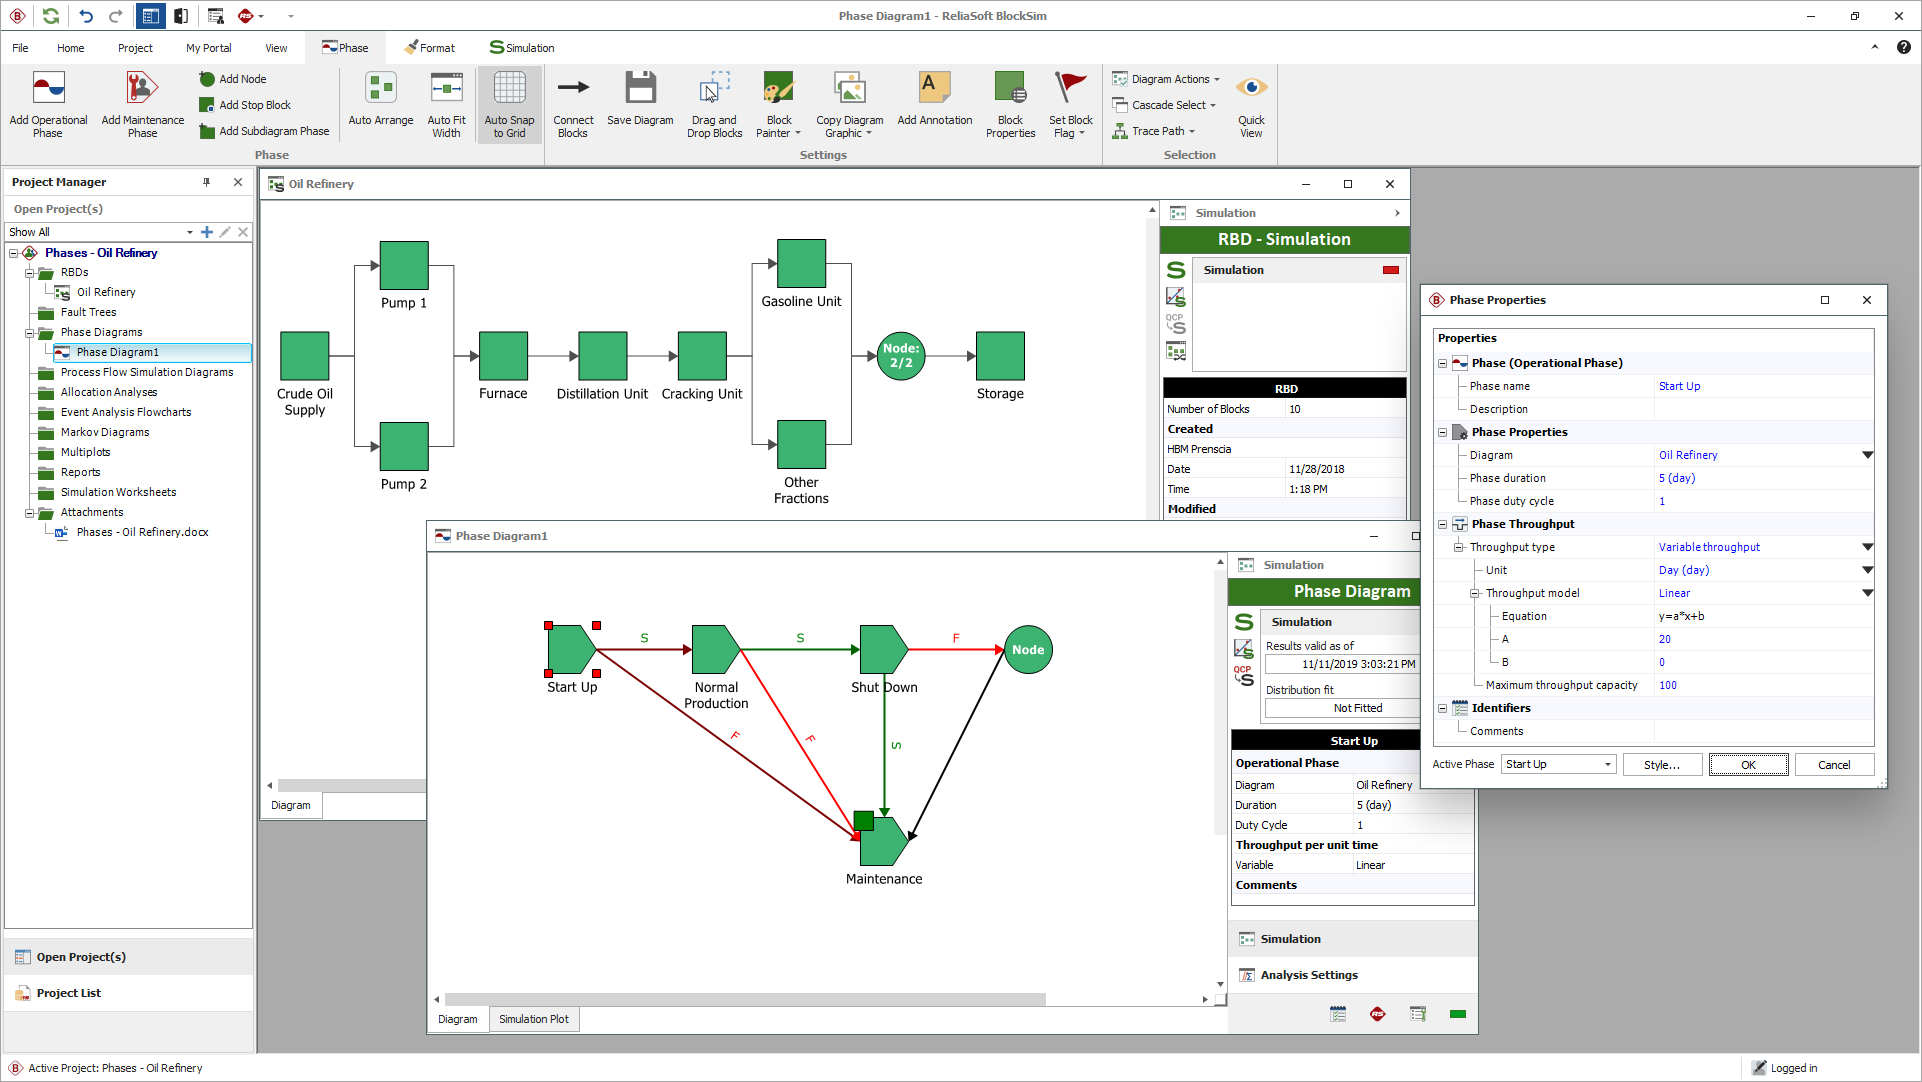
You can use reliability phase diagrams (RPDs) to model systems that go through different phases during the course of their operation. For example, some aircraft components operate only during the take-off and landing phases of a mission. Other components may experience a higher failure rate during certain phases due to higher stress.
In addition, the software uses Maintenance Phases to model scenarios in which a system goes directly to maintenance under specified conditions. For example, if a failure during the taxi phase sends an aircraft in for maintenance, it will start over from the beginning of the mission once repaired — not from the middle of the taxi phase where it was when the failure occurred, as other RBD analyses have been forced to assume. This flexibility provides a tremendous leap forward in the ability to simulate system operation more realistically.
BlockSim includes success/failure paths, for situations where a system proceeds to one operational phase upon success and a different operational phase upon failure. Node blocks and stop blocks are included as well.
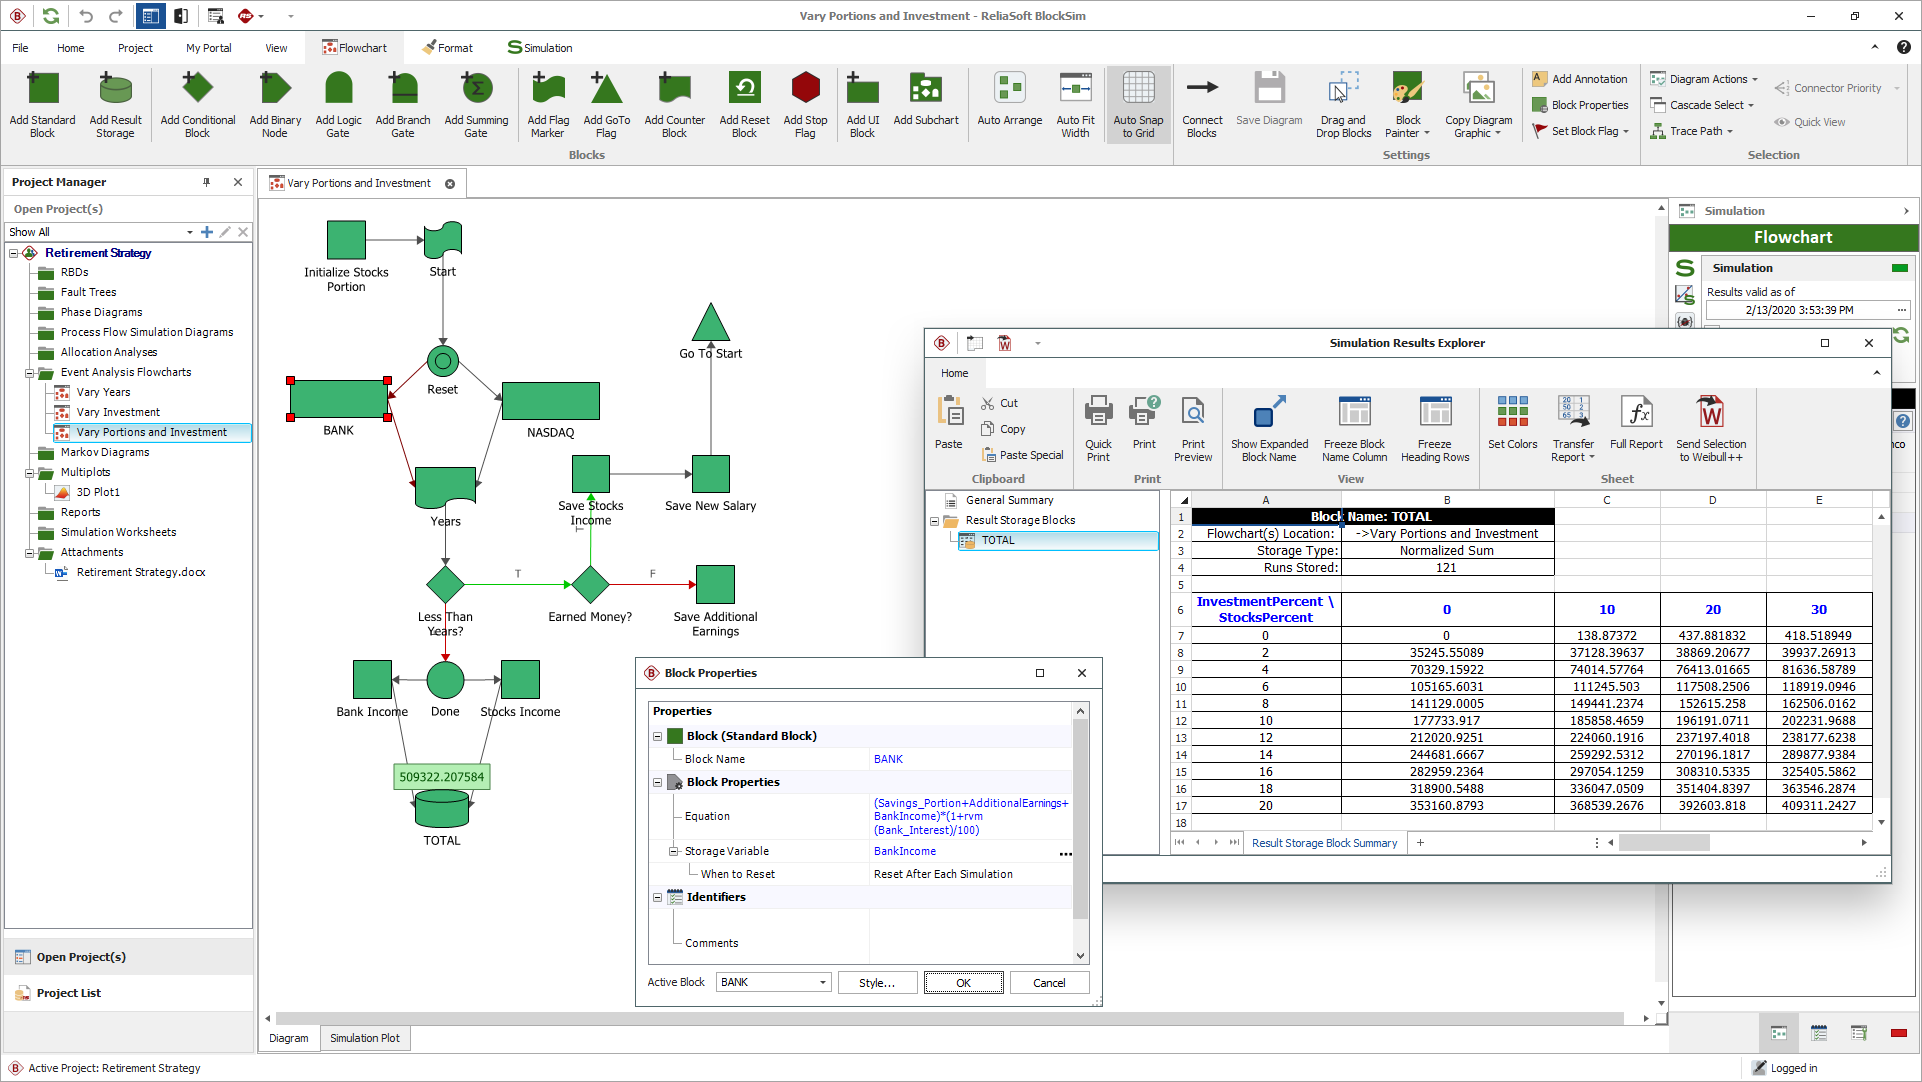
The Simulation Worksheets feature allows you to vary values that are used in BlockSim RBD or Event Analysis module simulations. This enables you to investigate the effect of one or more variables on the simulation results. With those two useful applications, you can:
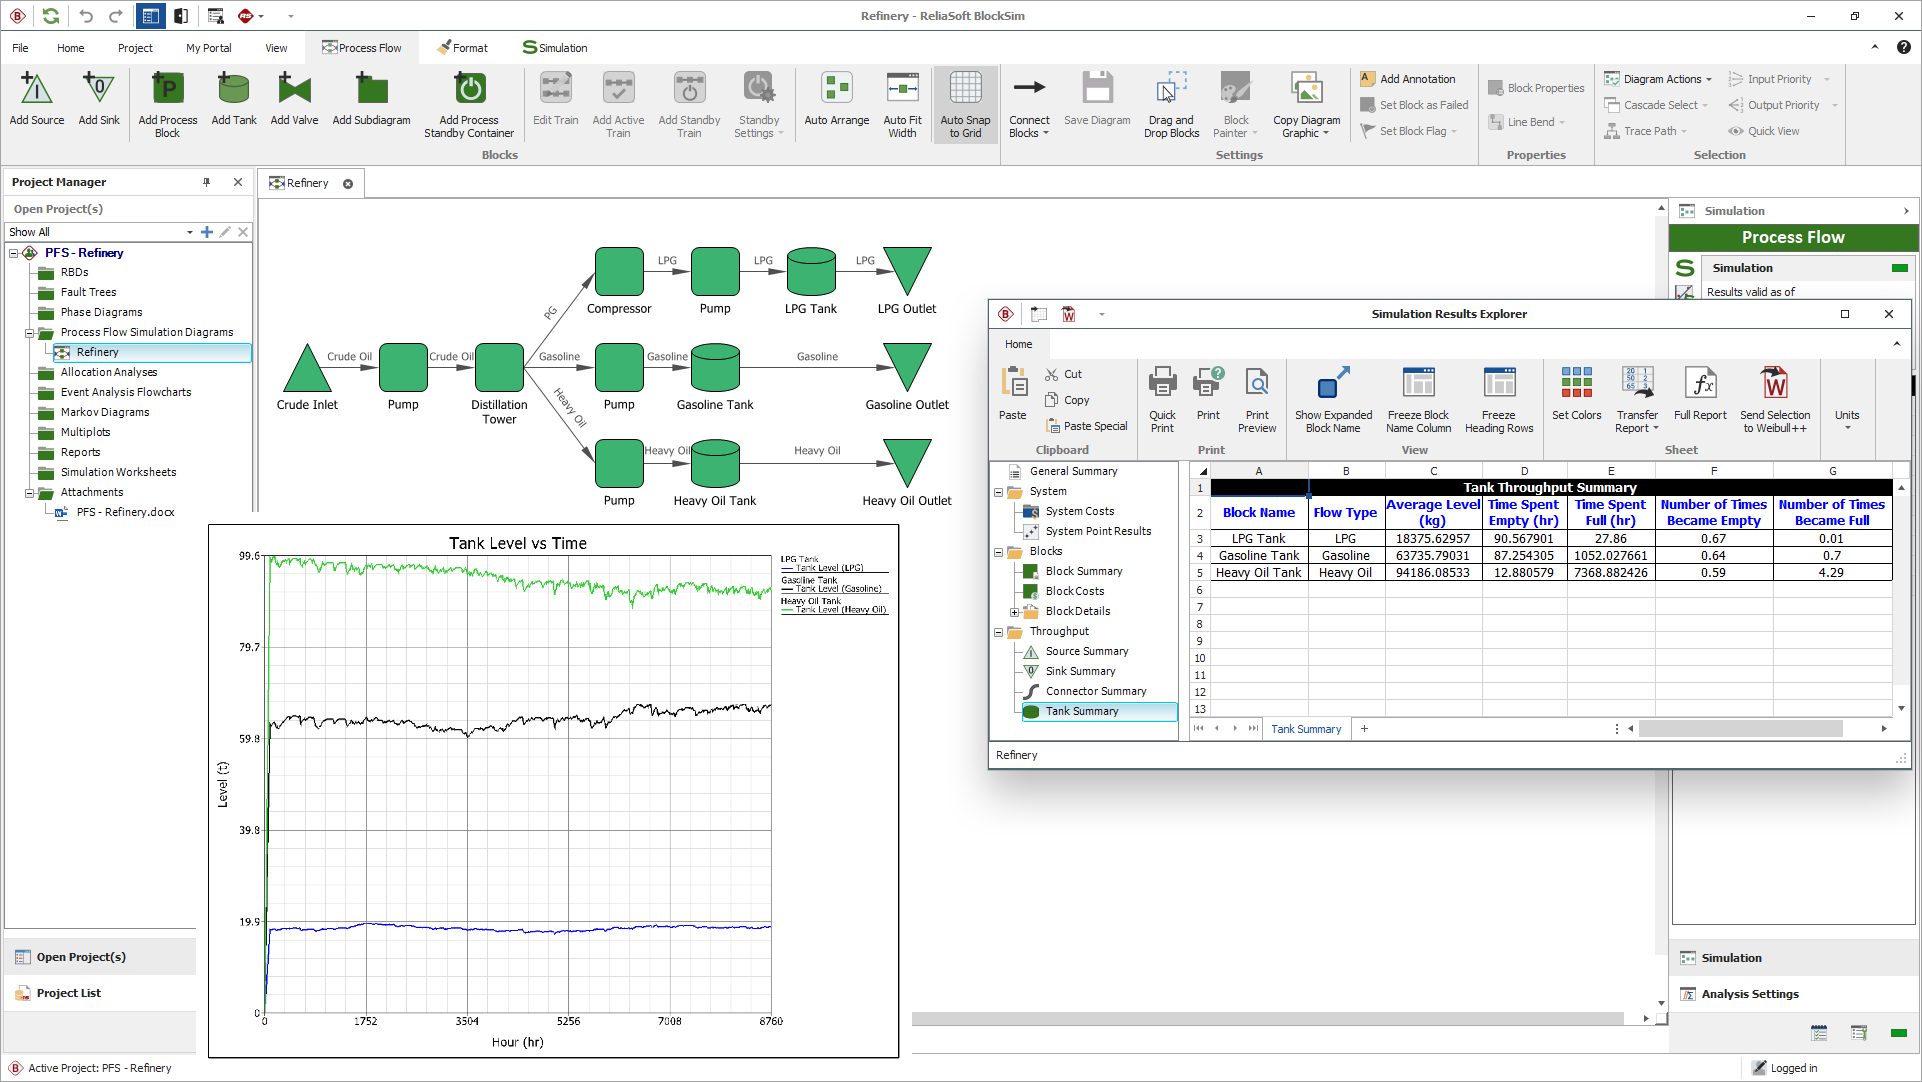
The throughput analysis can be used to identify bottlenecks, optimize resource allocation and otherwise improve the processing efficiency of the system. The software allows you to determine how the simulation will allocate the processed output across the paths defined in the diagram. It also allows you to specify how the backlog will be processed. When the throughput varies over time, BlockSim phase diagrams can be combined with models to describe the time-dependent variability (linear, exponential or power).
BlockSim allows you to run simulations in multiple threads. This may improve performance and save time when simulating complex diagrams. Additionally, the Batch Mode feature improves productivity by allowing you to schedule a series of simulations in advance.
Visualize your analysis results with variety of plots and charts options: