arrow_back_ios

Main Menu

See All Software di analisi e simulazione See All Software DAQ See All Driver e API See All Utilità See All Controllo delle vibrazioni See All Sistemi di alta precisione e calibrazione See All Sistemi DAQ See All Dispositivi portatili S&V See All Elettronica industriale See All Analizzatore di potenza See All Condizionatore di segnale S&V See All Trasduttori acustici See All Sensori di corrente e tensione See All Sensori di spostamento See All Sensori di forza See All Load Cells See All Multi Component Sensors See All Pressure Sensors See All Strain Sensors See All Estensimetri See All Temperature Sensors See All Tilt Sensors See All Torque Sensors See All Vibration Transducers See All Accessories for Vibration Testing Equipment See All Vibration Controllers See All Measurement Exciters See All Modal Exciters See All Power Amplifiers See All LDS Shaker Systems See All Test Solutions See All Actuators See All Combustion Engines See All Durability See All eDrive See All Production Testing Sensors See All Transmission & Gearboxes See All Turbo Charger

Accelerated Life Testing - Demonstrating the B10 Life

The accelerating stress for an electronic component is temperature. To meet the specified reliability requirement, the manufacturer is required to demonstrate with 90% confidence that 90% of the units will continue to operate for 1,000 hours under normal use conditions of 300 K. To save time and money, the manufacturer develops an accelerated life test designed to provide the desired reliability results in a shorter period of time than would be possible with a test performed under normal stress conditions.

Experiment and data


A sample of units are put to an accelerated life test with three different stress levels: 353 K, 373 K and 393 K. The failure times obtained during this test are presented in the table shown next.

This information can be used to determine the following:
a) What is the activation energy?
b) Is the B10 life of 1,000 hours at a 90% lower 1-sided confidence for the use stress level (300 K) demonstrated by the test?
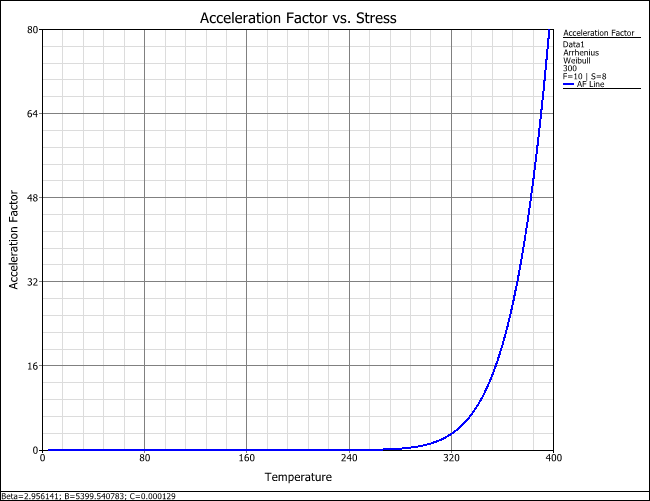
c) Plot the acceleration factor vs. stress for this accelerated life test.
d) Assuming that 1,000 units will be sold each month, determine the expected number of failures over the next six months so that an appropriate stock of spare parts can be kept on hand.

Analysis


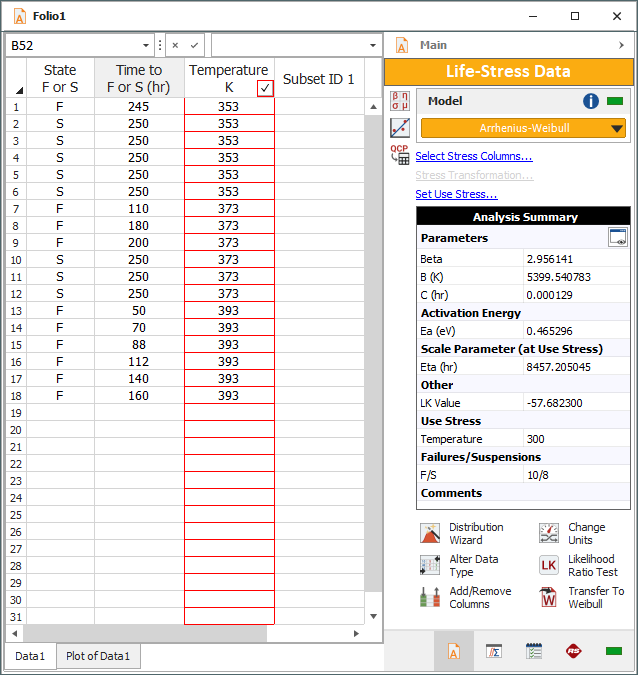
Step 1: Using Accelerated Life Testing or Accelerated Life Testing (PRO), the analyst creates a standard folio for failure and suspension times with one stress column for temperature (in kelvins, K), with a use stress level of 300 K. The data set is analyzed in Weibull++ using a combination of the Arrhenius model and the Weibull distribution. The results show an activation energy (Ea) = 0.465299, as shown next.

Figure 1: Calculated results from the simple accelerated demonstration test

Step 2: Once the parameters have been calculated, a variety of plots, results and reports can be obtained.


B10 Life: The QCP can be used to calculate the B10 life with the specified confidence bounds, as shown next.

Figure 2: The calculated B10 life with 90% lower one-sided confidence bounds

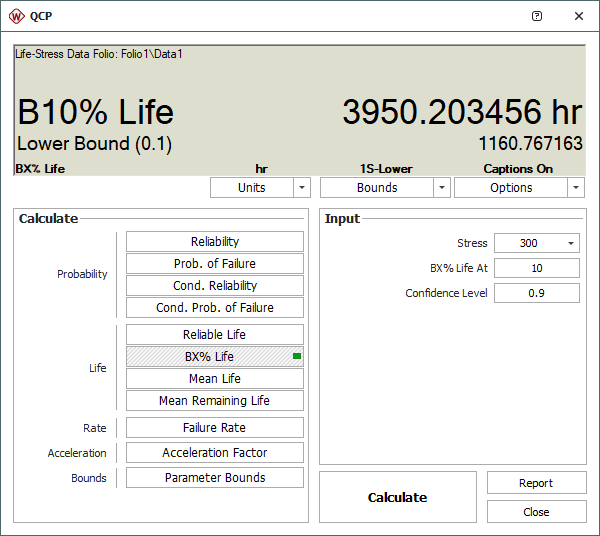
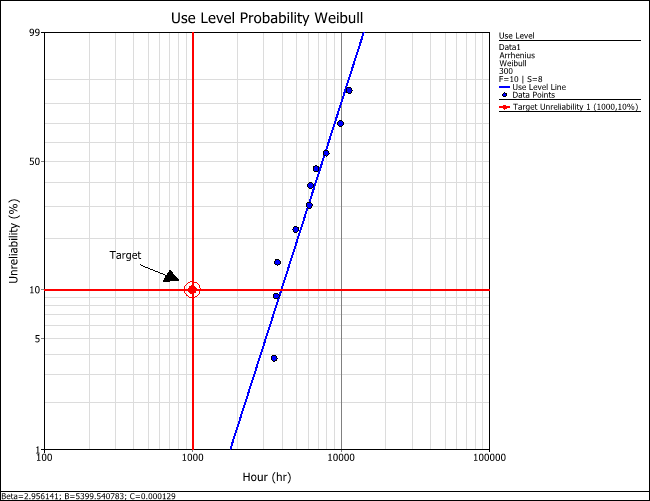
The B10 life demonstrated at the 90% lower 1-sided confidence is found to be 1,161 hours, well above the required 1,000 hours. You can also confirm that the product meets the target metric by marking the B10 target on a probability plot, as shown next (with the scaling adjusted to Y= 1 to 99 and X= 100 to 10,000).

Figure 3: Determining the B10 life demonstrated by the test from the use level Weibull probability plot

An Acceleration Factor vs. Stress plot is shown next (with the scaling adjusted to Y= 0 to 80 and X= 200 to 400).

Figure 4: Acceleration Factor vs. Stress plot for the accelerated demonstration test data analysis

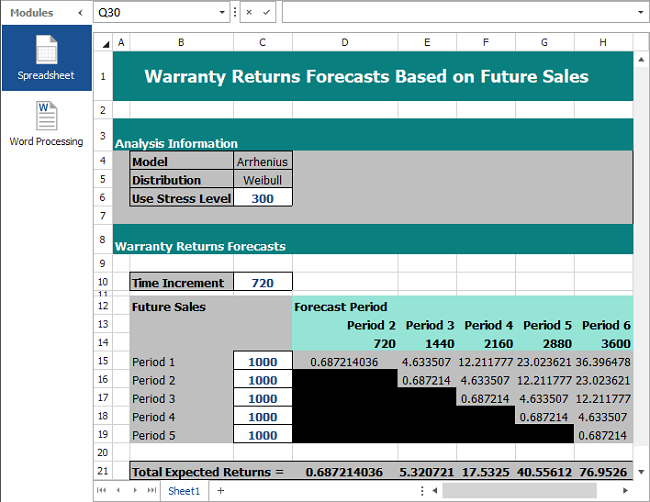
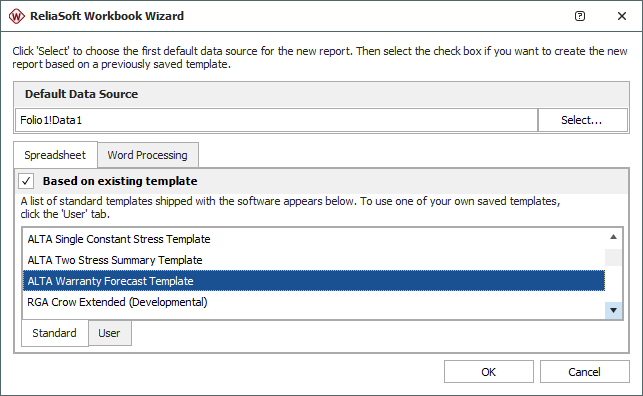
Expected Number of Failures: The analyst creates a ReliaSoft Workbook report using the data from the calculated standard folio and based on the "ALTA Warranty Forecast Template".

Figure 5: Setting up a new ReliaSoft Workbook

Then the following inputs are entered into the spreadsheet module of the ReliaSoft Workbook:

  • Use Stress Level: 300
  • Time Increment: 720 (24 hours/day * 30 days/month = 720 hours/month)
  • Future Sales (in the Warranty Returns Forecasts area) for Periods 1-5: 1,000


The final report is shown next.

Figure 6: Report using the data from the calculated standard folio and based on the "ALTA Warranty Forecast Template"