arrow_back_ios

Main Menu

See All Software di analisi e simulazione See All Software DAQ See All Driver e API See All Utilità See All Controllo delle vibrazioni See All Sistemi di alta precisione e calibrazione See All Sistemi DAQ See All Dispositivi portatili S&V See All Elettronica industriale See All Analizzatore di potenza See All Condizionatore di segnale S&V See All Trasduttori acustici See All Sensori di corrente e tensione See All Sensori di spostamento See All Sensori di forza See All Load Cells See All Multi Component Sensors See All Pressure Sensors See All Strain Sensors See All Estensimetri See All Temperature Sensors See All Tilt Sensors See All Torque Sensors See All Vibration Transducers See All Accessories for Vibration Testing Equipment See All Vibration Controllers See All Measurement Exciters See All Modal Exciters See All Power Amplifiers See All LDS Shaker Systems See All Test Solutions See All Actuators See All Combustion Engines See All Durability See All eDrive See All Production Testing Sensors See All Transmission & Gearboxes See All Turbo Charger

Degradation Analysis Example

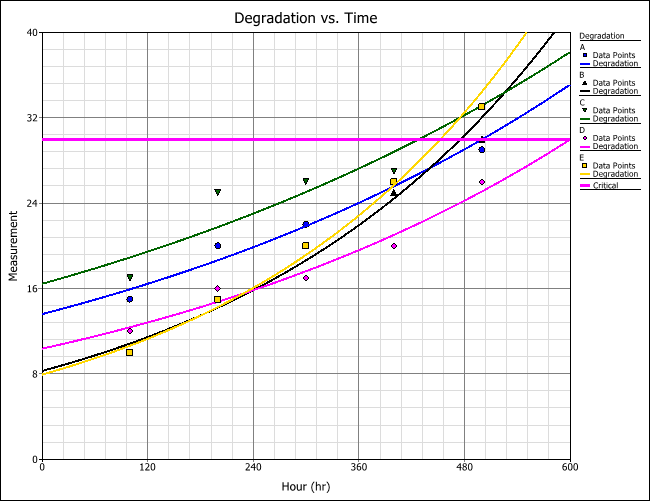
Five turbine blades were tested for crack propagation. The test units were cyclically stressed and inspected every 100,000 cycles for crack length. Failure is defined as a crack of length 30 mm or greater.


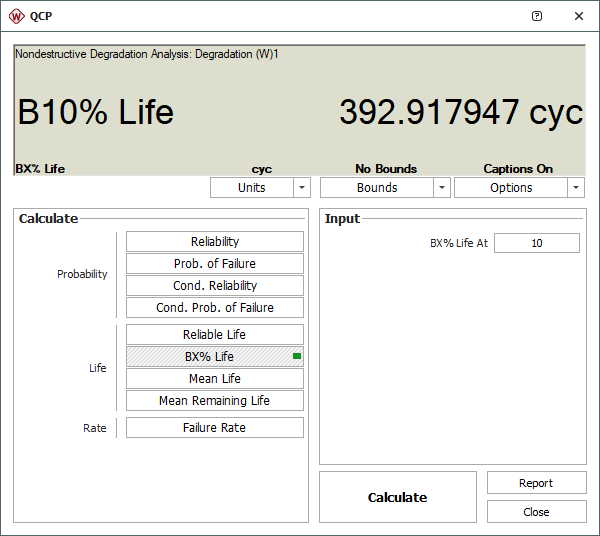
Using Weibull++ Degradation Analysis folio and Quick Calculation Pad (QCP), determine the B10 life for the blades using degradation analysis with an exponential model for the extrapolation.

Experiment and data


The following table shows the test results for the five units at each cycle.

Analysis


Step 1: Using Weibull++, create a degradation analysis folio and enter the data into the data sheet. Select Exponential for the model and enter 30 for the critical degradation level. These settings will be used to extrapolate a failure time for each unit. To specify how the failure times will be analyzed, select 2P-Weibull for the life distribution and select MLE for the analysis method. After you calculate the folio, it will appear as shown next.

Figure 1: Degradation folio with data and results

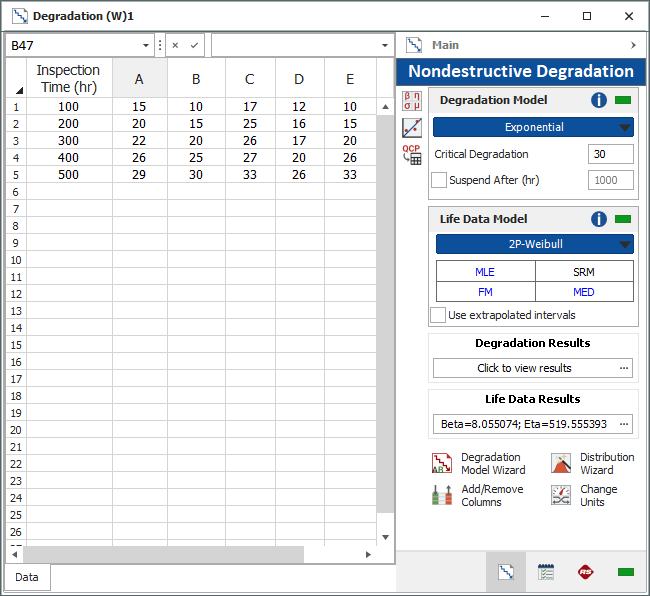
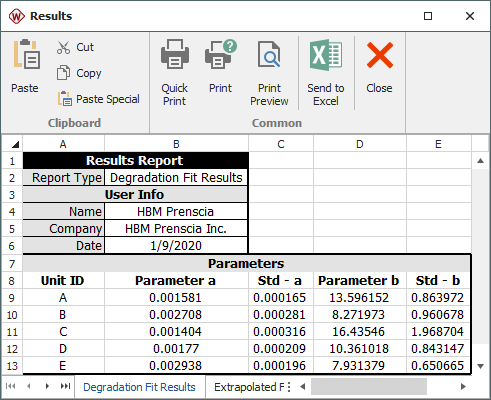
To view the parameters of the degradation model, click anywhere inside the Degradation Results area. The parameters will appear in the Results window, as shown next (the second tab of the Results window shows the failure times that were extrapolated from the model).

Figure 2: Results window showing the parameters of the degradation model
Step 2: Next, view the linear Degradation vs. Time plot for the degradation analysis, as shown next. This plot shows how each unit degraded over time, and the horizontal pink line indicates the level at which a unit is considered failed.
Figure 3: Degradation vs. Time (Linear) plot

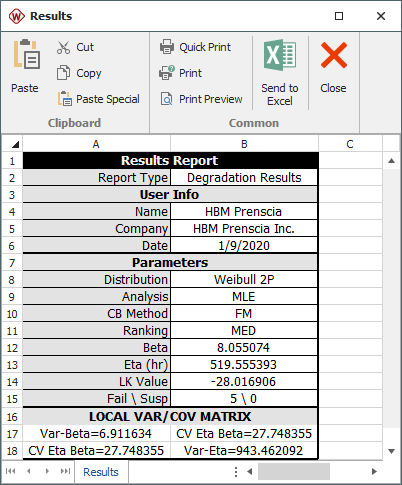
Step 3: Return to the data sheet, and then view the results of the life data analysis on the extrapolated failure times by clicking anywhere inside the Life Data Results area.

Figure 4: Results of life data analysis on the extrapolated failure times
Step 4: Using the QCP, the B10 life is calculated to be 392.9179 (x100) cycles, as shown next.
Figure 5: Using the QCP to calculate the B10 life