arrow_back_ios

Main Menu

See All Software di analisi e simulazione See All Software DAQ See All Driver e API See All Utilità See All Controllo delle vibrazioni See All Sistemi di alta precisione e calibrazione See All Sistemi DAQ See All Dispositivi portatili S&V See All Elettronica industriale See All Analizzatore di potenza See All Condizionatore di segnale S&V See All Trasduttori acustici See All Sensori di corrente e tensione See All Sensori di spostamento See All Sensori di forza See All Load Cells See All Multi Component Sensors See All Pressure Sensors See All Strain Sensors See All Estensimetri See All Temperature Sensors See All Tilt Sensors See All Torque Sensors See All Vibration Transducers See All Accessories for Vibration Testing Equipment See All Vibration Controllers See All Measurement Exciters See All Modal Exciters See All Power Amplifiers See All LDS Shaker Systems See All Test Solutions See All Actuators See All Combustion Engines See All Durability See All eDrive See All Production Testing Sensors See All Transmission & Gearboxes See All Turbo Charger

Reliability Analysis of a Storage Cluster System

This example is based on the example shown in Figure 8 of the article "Determining the Availability and Reliability of Storage Configurations" by Santosh Shetty, August 2002, as posted on Dell's website.

Example


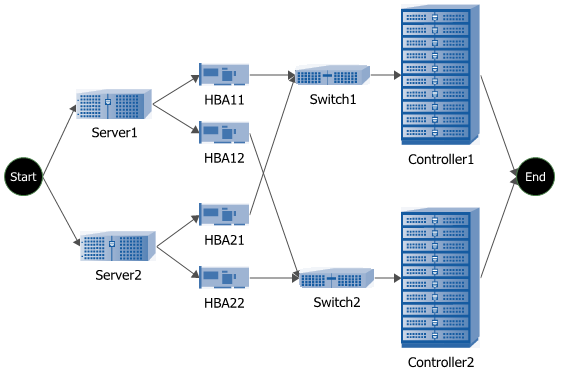
Consider a "high-availability" cluster with a reliability block diagram (RBD), as shown next.

Figure 1: Storage Cluster System

Assume the following life distributions and parameters for the components: (Note that this example, unlike the original article, assumes no repair of failed components.)


  • Server: Exponential with mean = 45,753 hours
  • Switch: Exponential with mean = 255,358 hours
  • HBA: Exponential with mean = 252,550 hours
  • Controller: Exponential with mean = 68,961 hours


The objective of the analysis is to study the reliability of the system.

Analysis


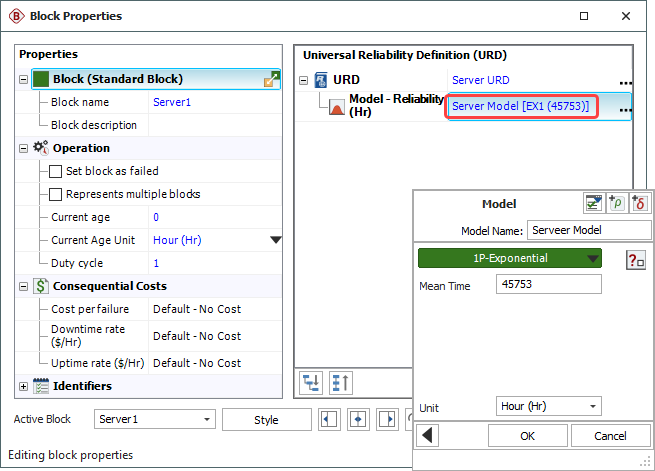
Step 1: Create the RBD of the system in BlockSim, and then use the given information to configure the universal reliability definitions (URDs) of each block. For example, the following picture shows the Block Properties window of Server1. The inset shows the Model Wizard, which allows you to define the failure model of the block. The URDs of the other blocks can be configured in a similar manner.

Figure 2: Block Properties Window of Server1 and Model Wizard (inset)

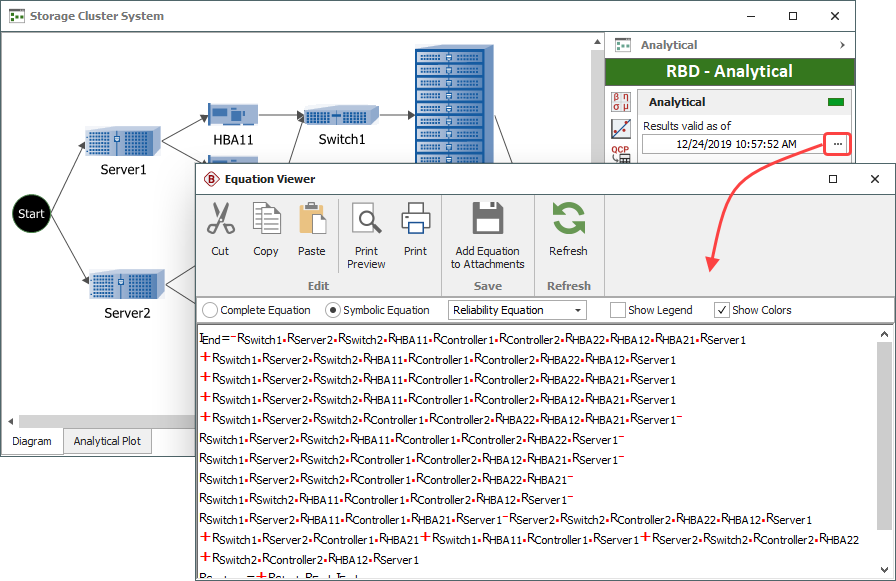
Step 2: Once the URDs have been configured, analyze the diagram and obtain the system reliability equation of the system, as shown next. In this equation, each R is the reliability (1-cdf) function of the item. As an example, RServer2 is the reliability function of Server 2.

Figure 3: System Reliability Equation of the Storage Cluster System

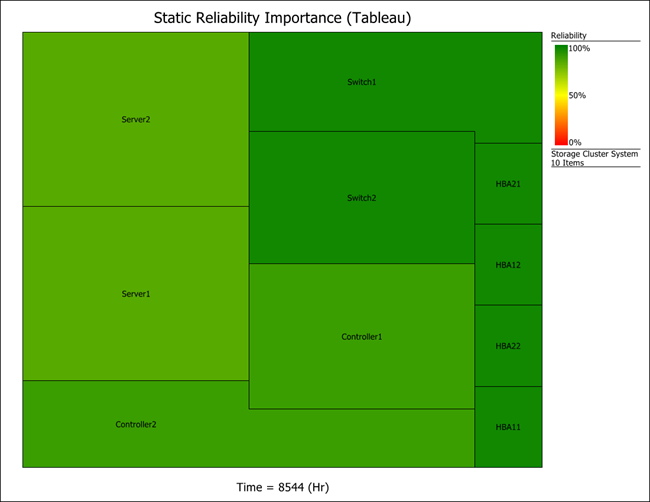
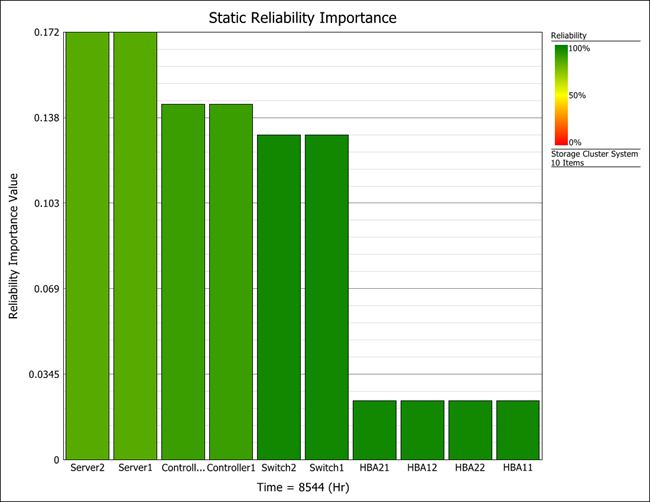
Step 3: Generate system level plots to see more information about the system. The next two charts are component reliability importance plots at t = 8544 hr. Both plots (a tableau area plot and a bar chart) illustrate the same concept; that is, the higher the importance of the component, the higher its effect on system reliability.

Figure 4: Static Reliability Importance - Tableau Area Chart
Figure 5: Static Reliability Importance - Bar Chart

As you can see, the servers in this configuration are the most critical component, while the hubs are the least critical.


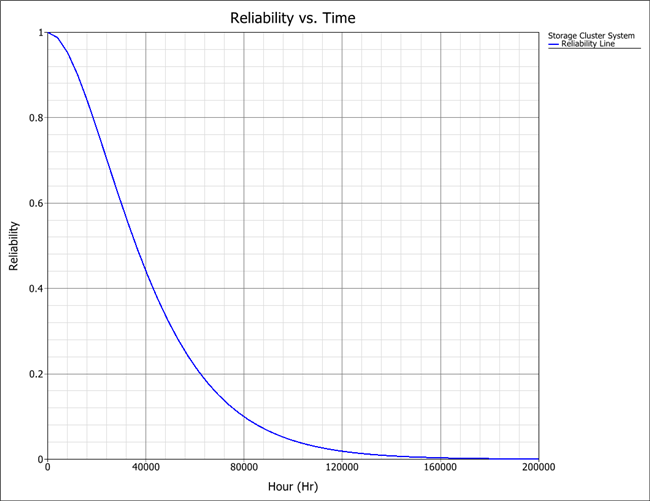
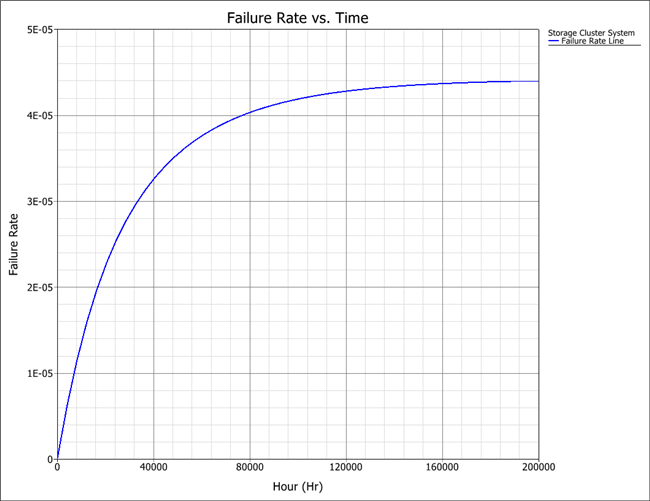
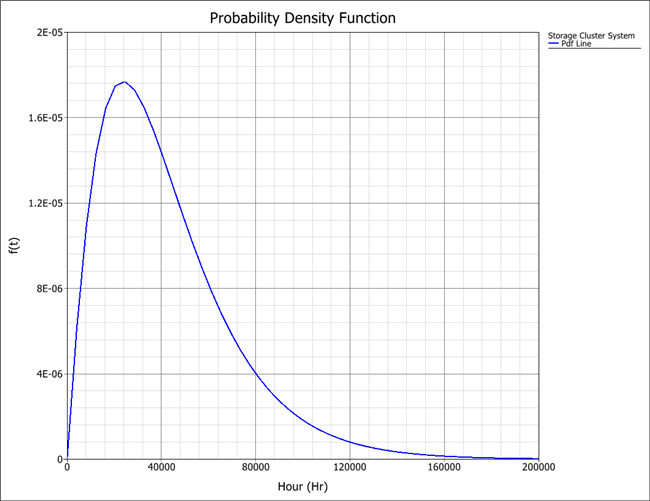
The following pictures show additional plots.

Figure 6: RI vs. Time Plot
Figure 7: System Reliability Plot
Figure 8: System Failure Rate Plot
Figure 9: System pdf plot

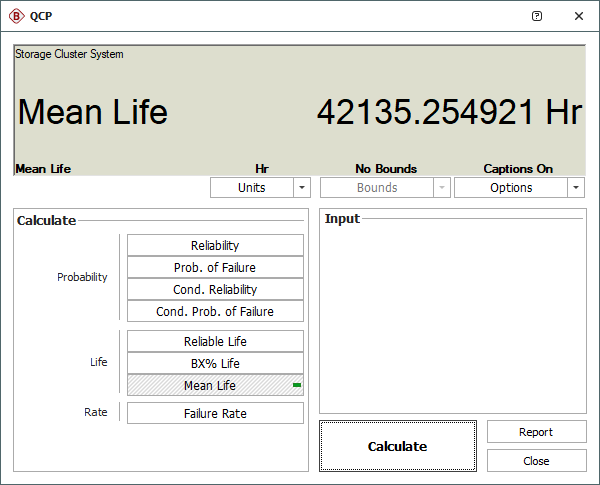
Step 4: Use BlockSim's Analytical Quick Calculation Pad (QCP) to obtain some of the most frequently requested reliability results. For example, the MTTF (mean time to failure) of the system is about 42,135 hours, as shown next.

Figure 10: Analytical QCP