In planning for your retirement, you normally invest a percentage of your income in "safe investments" (Bank) or in "riskier investments" (Stock Market). For this example, assume that you are choosing to invest some of your money in the bank and some in the stock market, and let’s say that NASDAQ is tied to the NASDAQ Composite Index.
In this example, ReliaSoft Weibull++ software is used to analyze data on average bank interest rates and NASDAQ annual returns to obtain the distributions and parameters used in the Event Analysis flowcharts created in BlockSim.
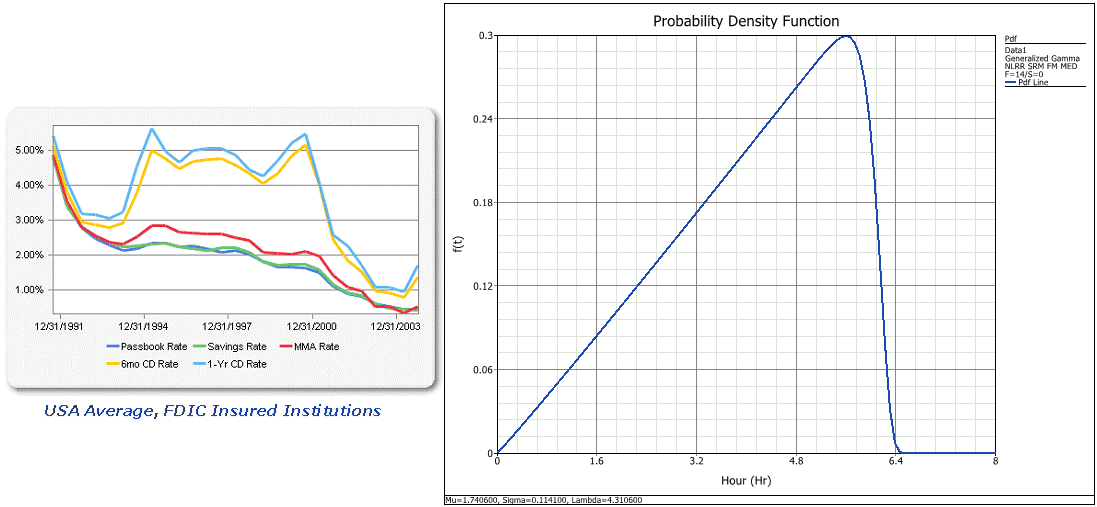
The interest from the bank investment follows a generalized gamma distribution with mean = 1.7406, standard deviation = 0.1141 and lambda = 4.3106.
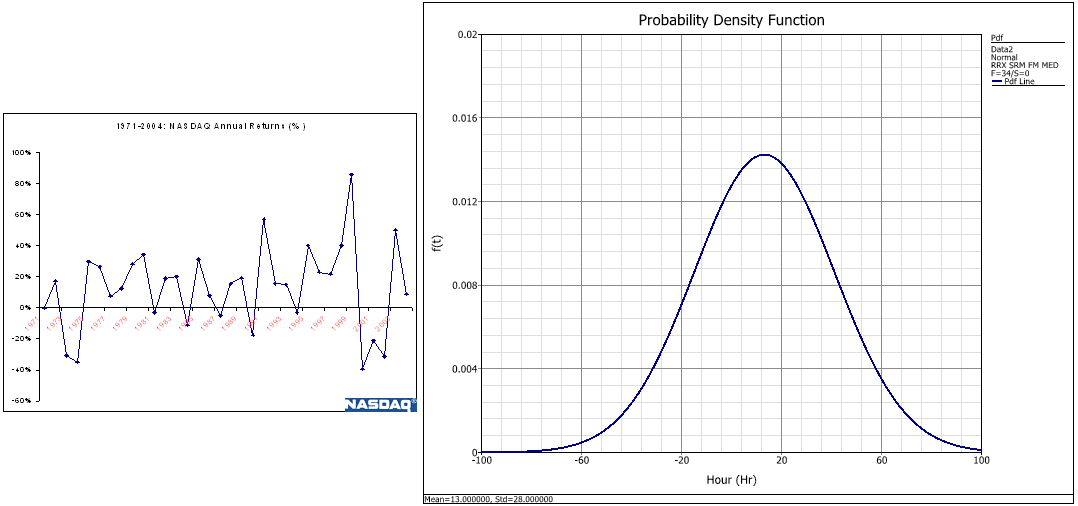
The profit from the NASDAQ investment follows a normal distribution with mean = 13 and standard deviation = 28.
Note that you can use the Weibull++ software to analyze data on average bank interest rates and NASDAQ annual returns to obtain the distribution and parameters for this analysis, as illustrated in the figures below.
You will invest X% of your income per year for the next Y years. Assume that your current income is $40,000 per year and, based on past history, your income will increase yearly by a percentage that is normally distributed with mean = 4 and standard deviation = 1.5.
You will put Z% of your investment money in the bank for the first year and the remainder in NASDAQ. Given the volatility of NASDAQ, the following strategy is applied for subsequent years:
Define models to describe the stock profit, bank interest and the yearly increase in your income, as shown next.
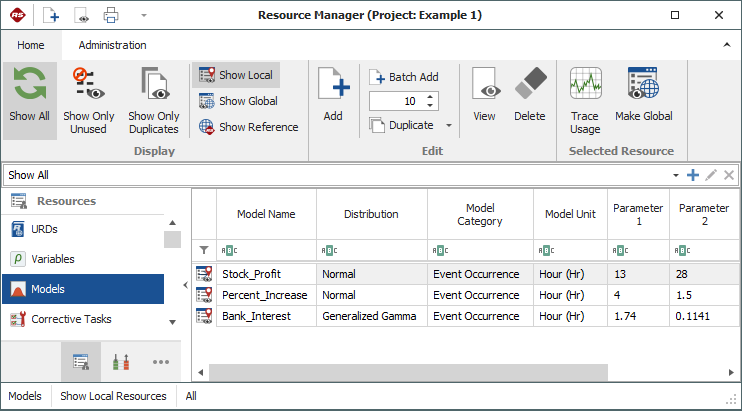
Note that even though the investments are measured in money, the Model Unit has been set to Hours. This is because event analysis flowchart results are always given in terms of the system base unit (SBU), and resources that require you to define a unit (i.e., models) will have their values automatically converted to base units during simulation. Therefore, whenever you don't want the software to convert the value obtained from a model resource, simply make sure the model uses a unit that is defined as equal to 1 SBU. See the application help file for more information.
For this example, whenever one of the models returns a value as "X hours," it should be read as "X dollars." If the model unit you are using is not equal to 1 SBU (choose File > Manage Database > Unit Settings to confirm), you will need to change the model units before resimulating the flowchart.
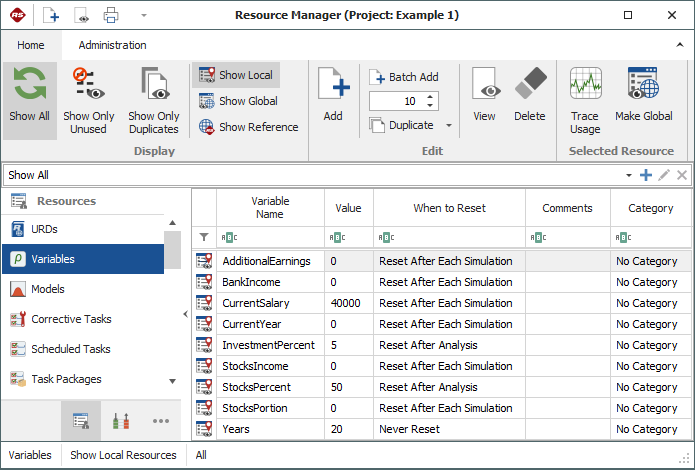
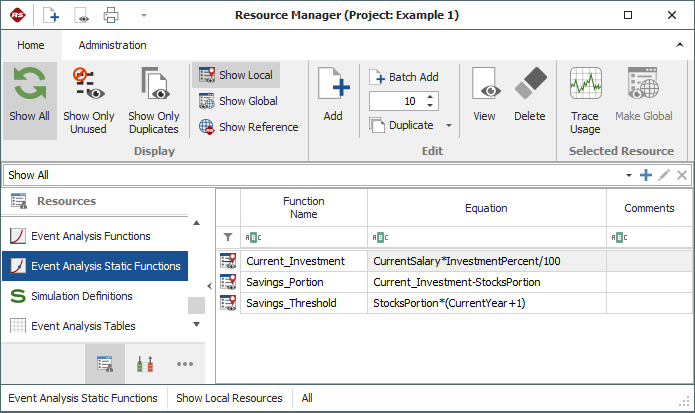
Define the following variables:
Define event analysis static functions to calculate the following:
Construct the flowchart shown below.
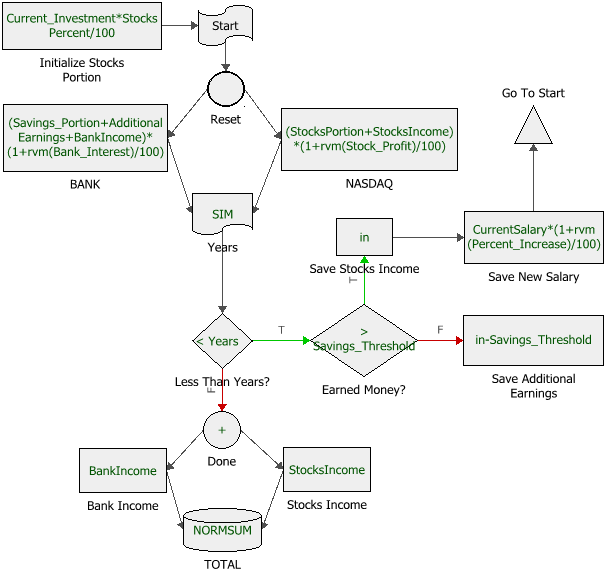
In order to keep track of how the investment incomes accumulate over the years, this flowchart is looped through. The loop is created by using the following blocks:
If the condition is not met (the number of years is up), then the value of the investments is calculated and then stored in the result storage block called "Total."
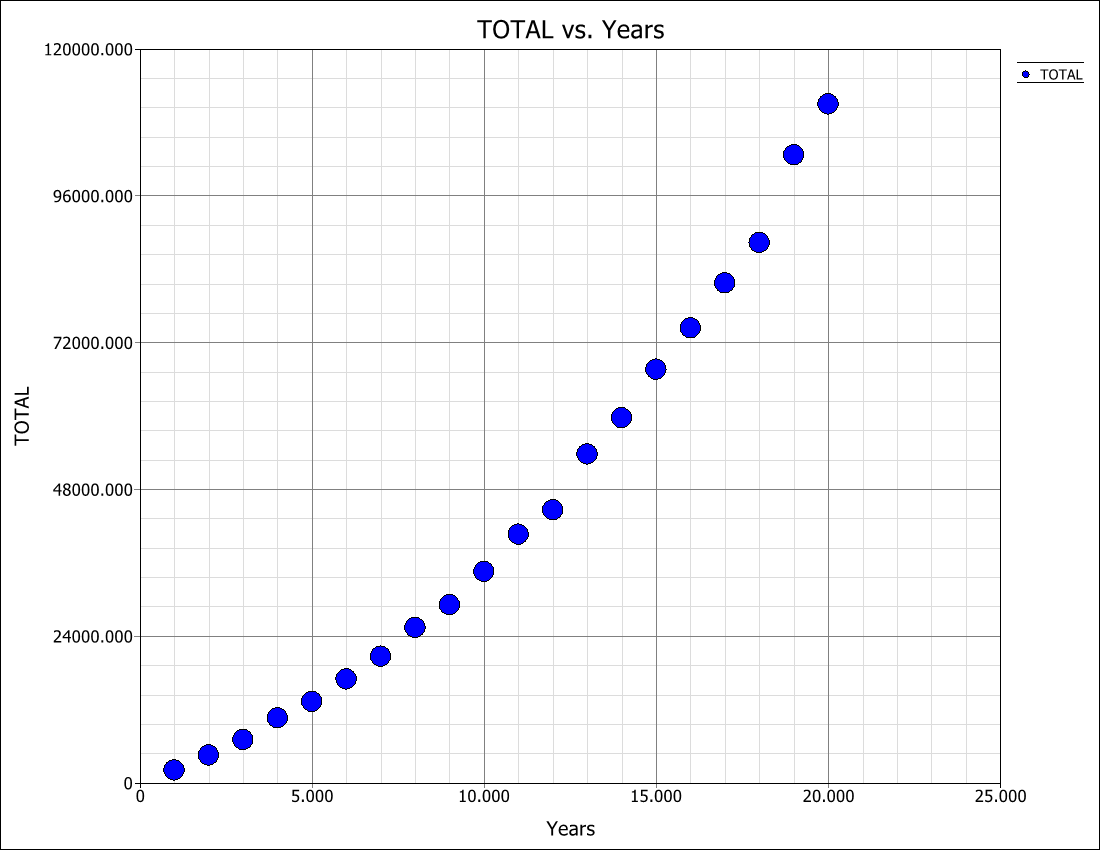
Estimate your investment income over the next 20 years if you invest 5% of your yearly income with 50% going to savings.
First, make sure that the initial value of the InvestmentPercent variable is 5 and the initial value of the StockPercent variable is 50.
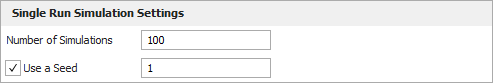
On the General Settings page of the Flowchart Simulation window, specify 100 simulations and a seed of 1 for repeatability, as shown next.
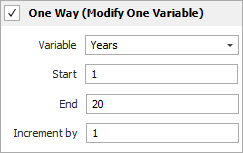
On the Sensitivity Analysis page, specify to vary the number of years from 1 to 20, and use an increment of 1.
When the simulation completes, close the Flowchart Simulation window and then click the Plot icon on the diagram’s control panel. The results are displayed in the following plot with the plot scaling adjusted to Y = 0 to 120,000 and X = 0 to 25.
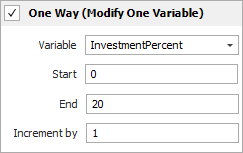
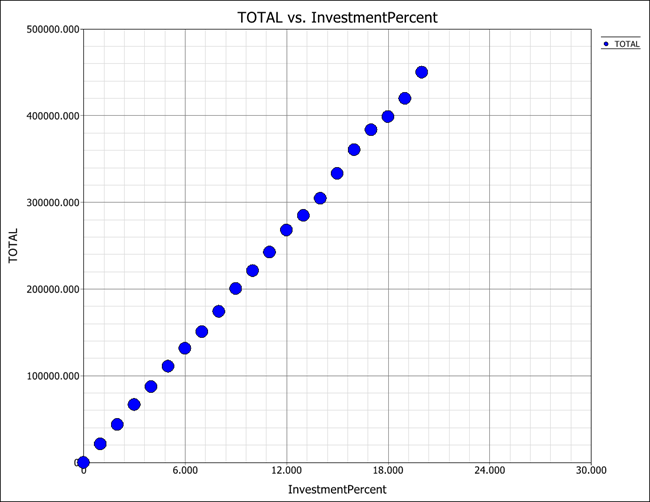
Compare your investment income after 20 years, varying the investment portion from 0% to 20% of your yearly income.
To vary the investment portion, configure the Sensitivity Analysis page as follows and repeat the simulation.
The results are displayed in the following plot.
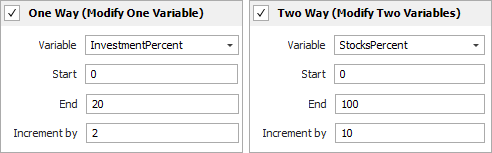
Compare your investment income after 20 years, varying the investment portion from 0% to 20% of your yearly income and varying the amount invested in savings from 0% to 100%.
To vary both the investment portion and the savings portion, configure the Sensitivity Analysis page as follows and repeat the simulation.
To view the results in a three-dimensional plot, click the 3D Plot icon on the control panel. The following plot shows the results.